Joseph Juran, a highly influential American quality specialist, defined the term “breakthrough” (which was very popular in the late 1980s and early 1990s) as “an improvement to unprecedented levels of performance”. He pointed out:
All breakthrough is achieved project by project, and in no other way.
Joseph Juran, 1988, Juran’s Quality Control Handbook, fourth edition, McGraw-Hill, New York, p. 22.
To achieve significant improvements in capability and performance, in line with the priorities in a school plan, improvement projects are needed.
Improvement plans need to be broken down into finite, definable projects that can be managed over the life of a plan.
A project is a temporary endeavour undertaken to meet specific goals and objectives with a defined beginning and end.
Projects and processes
Projects contrast strongly with daily routines. Daily routines involve the ongoing enactment of an organisation’s processes.
Projects are temporary endeavours to improve an organisation’s processes, to create new products, services or processes, or to build infrastructure.
In short, working in the system is accomplished by process; working on the system is accomplished by project.
Project teams, not committees
This presents a challenge for schools, which are accustomed to establishing committees rather than project teams.
Committees are a common feature of schools. They usually carry responsibilities associated with management and improvement in specific areas of school endeavour but are problematic in that they have an ongoing role and can easily be distracted from improvement efforts.
Project teams are formed for specific, defined timeframes and purposes. Guided by a precise purpose and structured processes, such as the Plan-Do-Study-Act cycle, project teams usually realise greater success. They stay focused and can maintain the energy necessary to see through the improvement, due to a tight, defined timeframe and an effective progress reporting approach.
Our study of schools, in Australia at least, reveals that schools in general, have neither well-developed project management methodologies, nor the management structures and disciplines to execute their improvement plans in this manner. This is a significant capability gap. Until these structures and disciplines are more strongly established, school improvement efforts are likely to continue providing disappointing results.This is not a criticism of schools or those that work within them, rather it is an observation of a systemic failure, which needs to be addressed by senior administrators and policy makers.
An Improvement Project Brief can be used to agree and document the arrangements for each project team.
Collectively, the annual set of improvement projects can be documented and monitored through the annual improvement plan.
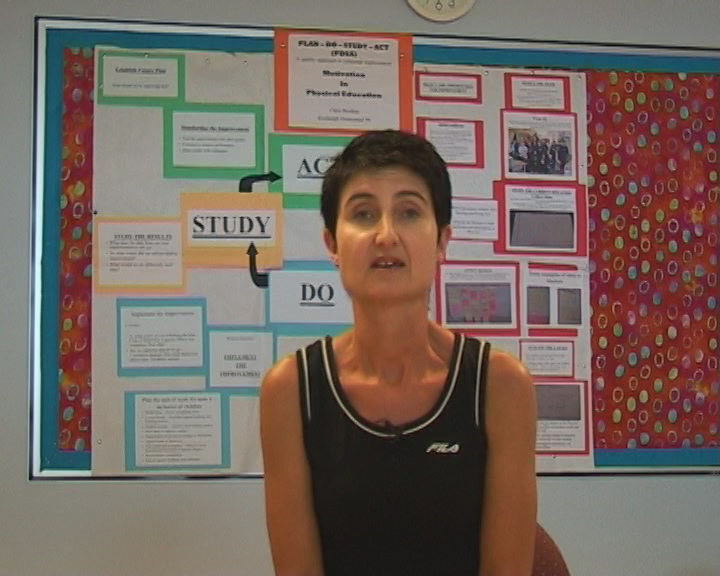
We have previously discussed the power of the Plan-Do-Study-Act (PDSA) cycle in bringing about collaborative, sustainable improvement. We have also emphasised the importance of allowing students to play a key role – giving students a ‘real voice’ – in improving their school and classroom. In this blog, we share another example. This time, how the PDSA process was used by a teacher and students to improve learning and engagement in their physical education (PE) classroom. (You can also view this as a QLA case study video.)
Teacher, Chris, with her PE class PDSA storyboard
Chris is a leading specialist teacher at a Victorian primary school. She observed the school’s Year 6 students becoming increasingly disengaged during their weekly PE lessons. PE teachers were stressed and student behaviour was worsening. No one was enjoying PE!
Chris decided it was time to set students and teachers to work to improve PE by applying the PDSA cycle.
As we have seen previously:
PDSA is a highly effective improvement approach, based upon a cycle of theory, prediction, observation, and reflection.
It involves applying a structured process to achieve sustainable improvement.
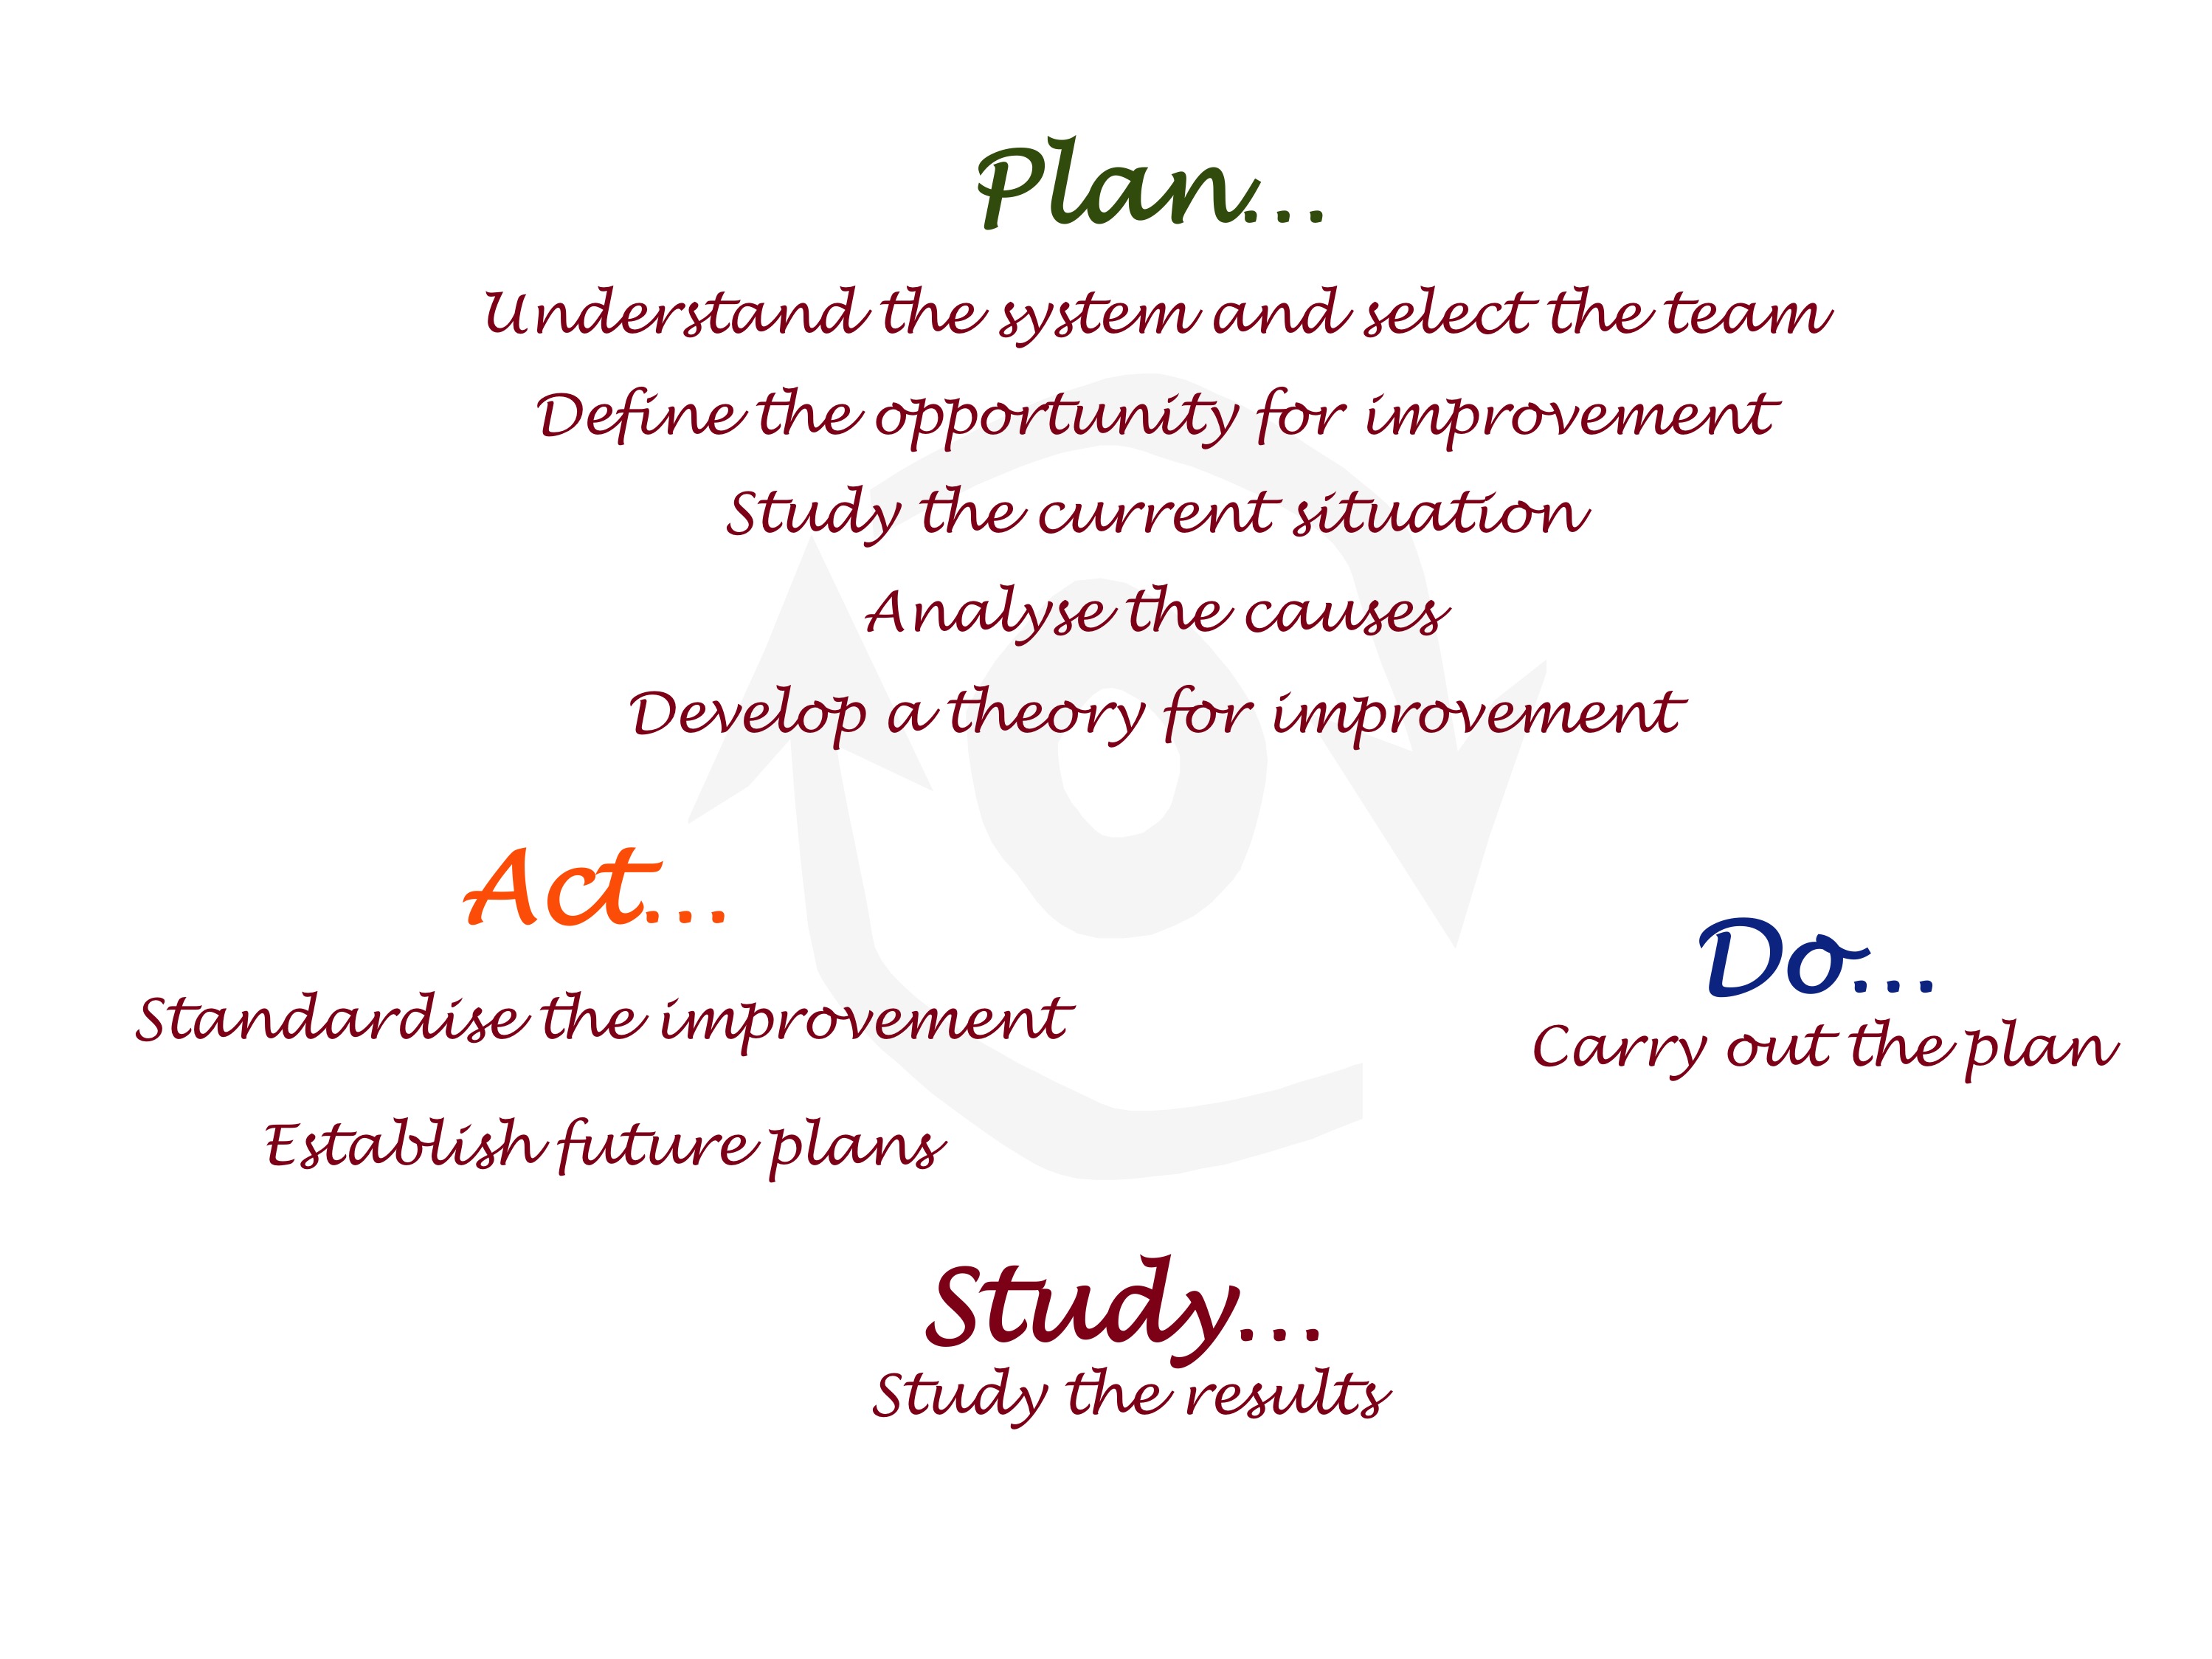
A nine step PDSA process
This includes:
defining the opportunity for improvement by agreeing the purpose and establishing a shared vision of excellence
focusing improvement efforts on a system or process (rather than blaming individuals)
identifying root causes not symptoms
developing and applying a theory for improvement
reflecting on the outcomes achieved to agree a new ‘best method’ or further improvement needed.
Here’s how…
Chris applied the PDSA process with her students. They documented a comprehensive storyboard to capture their agreements, the data collected, and to reflect their progress in applying the PDSA process.
Here’s what they did:
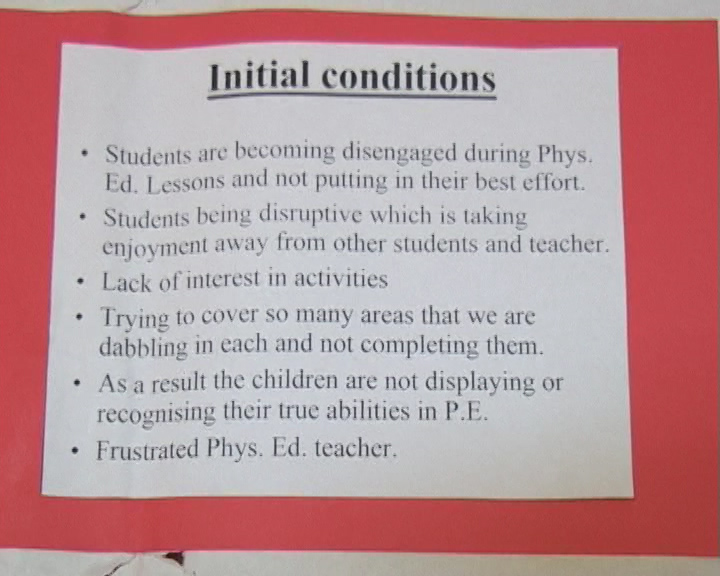
Students and teachers discussed to agree the opportunity for improvement – to improve their PE classes.
They studied the current situation – what did PE currently look like, feel like, and what was going on? They agreed: students were disengaged, disinterested and not putting in their best efforts; some students were disrupting the class, preventing others from enjoying PE; and teachers were frustrated.
PDSA storyboard extract: brainstorm of the current situation in PE
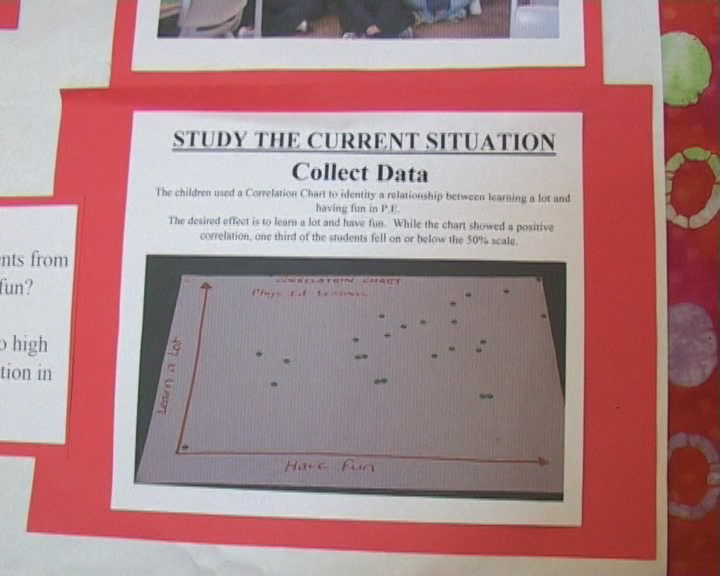
They collected data to measure the extent of the dissatisfaction with PE. A correlation chart was used to measure student
PDSA storyboard extract: collecting data using a correlation chart – how much are students enjoying and learning in PE?
perception. The data revealed low levels of student enjoyment
(fun) and learning in the PE classroom.
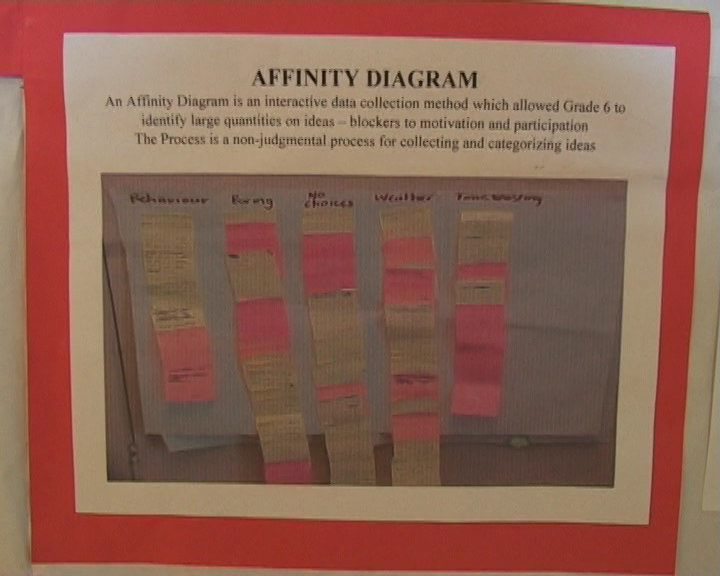
Students then brainstormed and themed the drivers and barriers associated with motivation and participation in their PE classroom. They used sticky notes and an affinity diagram to facilitate this. The major barriers they identified were: ‘inappropriate behaviour’, ‘boring classes’, ‘lack of student choice’, ‘the weather’ and ‘wasting time’.
PDSA storyboard extract: affinity diagram of the barriers to student motivation and participation in PE
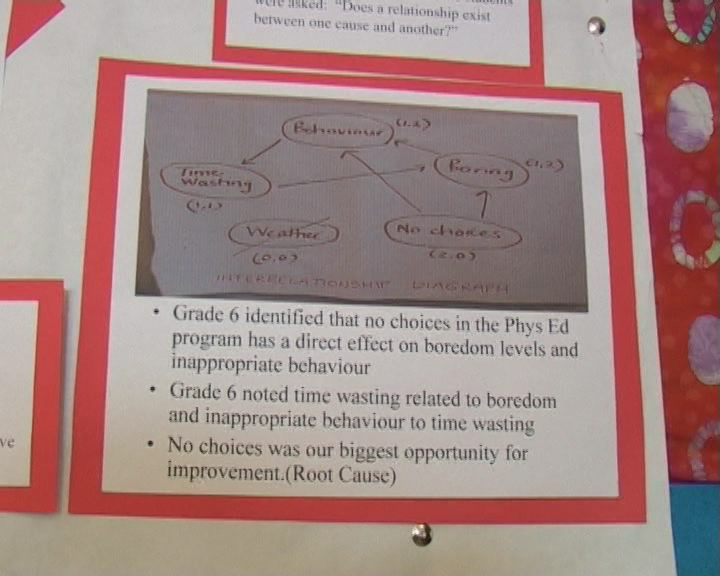
These barriers were analysed to agree the root causes using an interrelationship digraph. (They knew that by working on the root causes of their problem that they would realise the greatest return on their improvement efforts.) For the PE students this revealed ‘lack of choice’ as the major or root cause. A lack of choice by students in their PE lessons was seen as a major barrier to participation and motivation. It was impacting upon the other causes and driving the observed problems with behaviour and performance in their classroom.
PDSA storyboard extract: interrelationship digraph analysing the root causes of a lack of student motivation and participation in PE
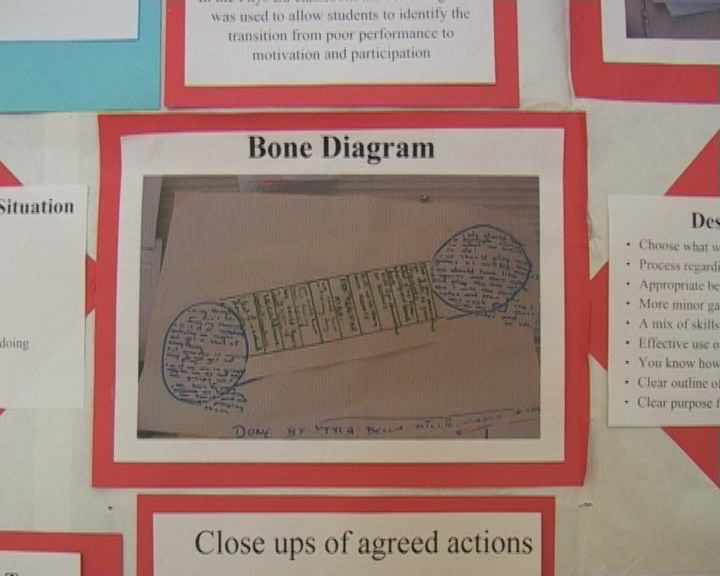
A bone diagram was used with students to further explore the current situation, and to agree a vision of excellence for PE – what they wanted PE to be like. The resulting student vision showed students believed: student choice, a clear purpose and process for each session, appropriate behaviour, more minor games, a mix of skills, effective use of time, student’s understanding what was expected, and knowing whether they were improving; were the key characteristics students believed were essential for a great PE lesson.
PDSA storyboard extract: bone diagram agreeing a vision of excellence for PE
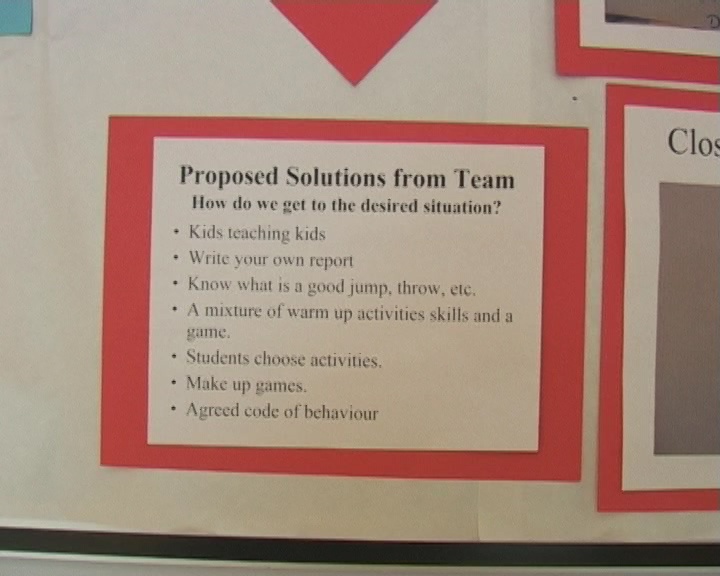
They brainstormed possible solutions which included: ‘kids teaching kids’, students ‘choosing activities’ and ‘writing their own report’, agreeing a student ‘code of behaviour’, clarifying expectations (quality criteria: ‘know what a good throw, jump looks like’), and students ‘making up games’.
PDSA storyboard extract: brainstorm of possible solutions to improve PE
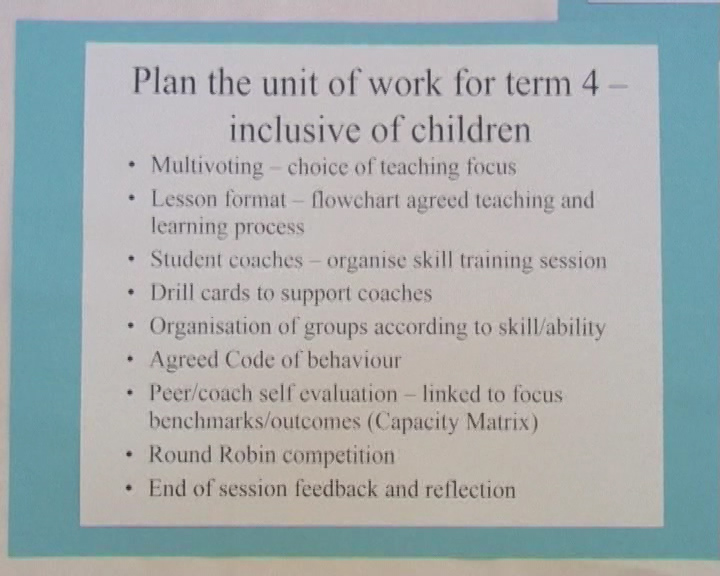
These solutions helped them to develop a ‘theory for improvement’ comprising the following key strategies:
multi-voting to agree the focus of each lesson
agreeing the lesson format – flowcharting the teaching and learning process
appointing student skill coaches and documenting skill cards to help the coaches do their job
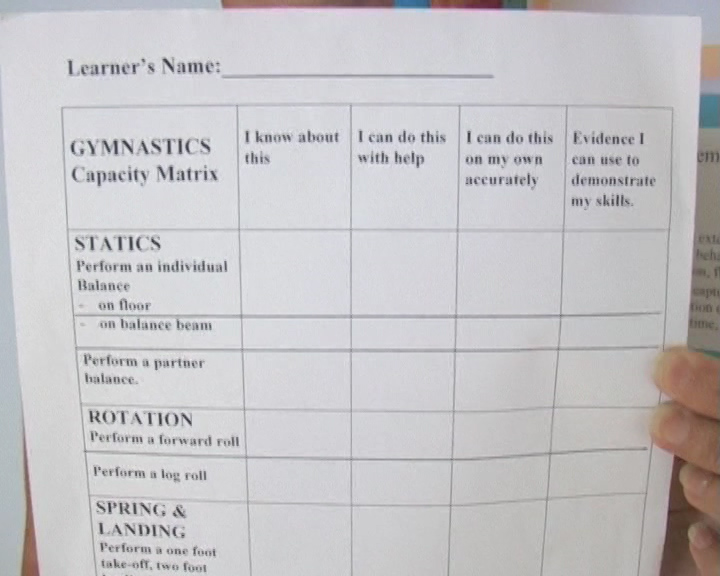
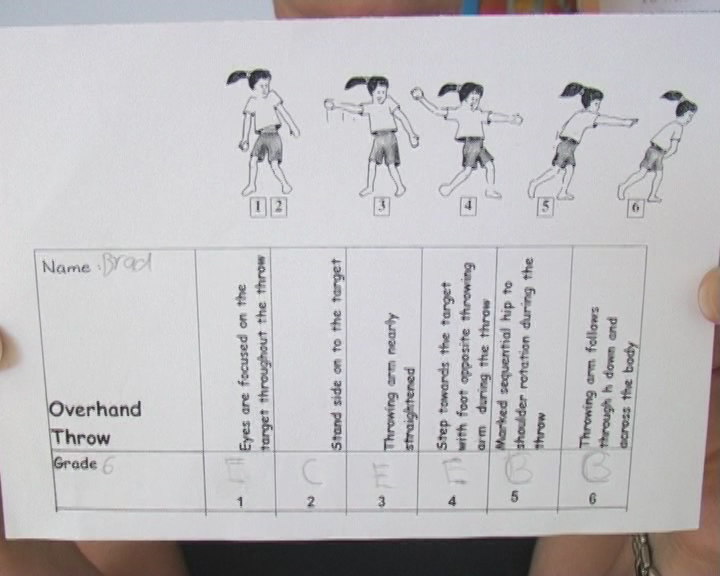
students undertaking peer evaluation together with their teacher/coach. They developed capacity matrices for key areas of learning to help them to do this. They also documented quality criteria describing how to execute essential skills with a high degree of excellence (e.g. how to do an overhand throw). Students used the capacity matrices and quality criteria as the basis for reflection and evaluating their progress in PE
agreeing a code of behaviour
everyone reflecting and giving feedback after each lesson.
PDSA storyboard extract: agreed strategies to improve PEPE – capacity matrix for gymnasticsPE – quality criteria for an overhand throw
The outcome?
The PE classes applied the agreed strategies and new processes, and a few weeks later reflected on the effectiveness of the improvements they had made (the ‘study’ phase of the PDSA
process).
Behaviour and engagement improved. Students were motivated and learning
Students ‘owned’ and were running the PE lessons with minimal guidance from PE teachers! They were responsible for their learning
PE lessons had a productive ’buzz’! Students were excited. Teachers were happy.
The processes they had developed together were adopted as the new way for PE lessons.
Chris described the PDSA based collaborative process as having an amazing impact.
Applying the PDSA process, working ‘with the kids’ and not ‘doing to the kids’, brought about significant positive change to PE lessons – improving the way teachers were teaching and students were learning – to great effect!
What is your school’s theory of teaching and learning?
Some schools waste time focusing their efforts on trying to control and manage the actions and behaviours of individuals. They would do better examining the underpinning theory, systems and processes driving the action and behaviour. Reflecting deeply on, and defining (making explicit), the beliefs upon which current approaches to learning and teaching are based, can lead to great focus, alignment and return on efforts to improve.
Fundamental to improving learning is to agree (define) the theory guiding our teaching and learning.
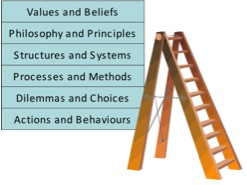
The following anthropological model adapted from the work of Martin Weisbord can help us understand why this is so. It describes a hierarchy of influences on organisational behaviour. The model is consistent with Deming’s teachings on how systems drive performance and behaviour, and the need to develop theory to drive improvement.
Weisbord’s anthropological model illustrating an organisational heirachy of theory driving action and behaviour
Weisbord’s model illustrates the relationship between beliefs, philosophy (theory), systems, processes, choices and action. An organisation’s systems and processes reflect and reinforce its values, beliefs and philosophy. These systems and structures dictate the processes and methods, and shape the dilemmas and choices faced by individuals of the organisation. The choices made by individuals, in turn, produce the actions and behaviours we observe.
Let’s look at an example to illustrate. Say we believe students are inherently lazy, that they have little desire to improve, and need to be motivated to learn. We will then develop systems and processes in our school and classrooms in an attempt to extrinsically motivate them. Our systems and processes will usually be based upon incentives and rewards, fear and punishment. If, however we believe we are born with an innate desire to learn and to better ourselves, and that the motivation to learn comes from within, then we will design very different systems of learning in our classrooms. These systems usually focus upon building ownership of learning, and working with students to identify and remove the barriers to their intrinsic motivation and learning.
Defining a theory and designing systems and processes can be a deliberate and thoughtful action or it can occur through natural evolution – the choice is ours.
We can make a conscious choice to define and make explicit our values and beliefs regarding teaching and learning. An operational definition is used to achieve and document a shared understanding of the precise meaning of concept/s. Operational definitions provide clarity to groups of individuals for the purposes of discussion and action.
It follows that once we have defined our theory of teaching and learning, we can design structures, systems, processes and methods that are aligned to it and naturally promote the actions and behaviours we desire.
Of course, we draw upon evidence-based research to craft our theory. We can then work together over time testing, reinforming and reaffirming this theory, and improving systems and processes to produce the performance and behavioural outcomes we wish to see.
How to…
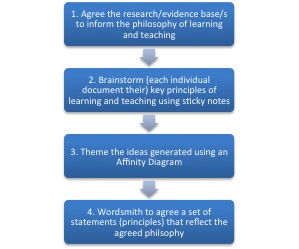
Our work with schools in defining a learning and teaching philosophy has typically followed the process summarised in the flowchart below. All staff are invited to be involved in agreeing the philosophy which takes place through one or more workshops.
Flowchart of a process to create a school learning theory
Step 1. Agree a research or evidence-base to inform the philosophy
The first step is to agree and draw upon a research or evidence-base to inform the philosophy. Education systems in Australia have, over time, adopted different pedagogical models. Schools have adopted many different models, all purporting to reflect the latest research and providing the theory necessary to guide excellent teaching practice. The Quality Teaching model, the National School Improvement Tool, the e5 Instructional Model, and the International Baccalaureate are examples of pedagogical models currently in use. Explore the preferred model/s with all staff before defining your philosophy to agree which one or more resonate and align with the needs of your learning community. Of course, if there is a model that adequately describes the philosophy to teaching and learning that your school community wishes to adopt, the job is made easier. Job done – just agree to use it!
Step 2. Brainstorm ideas
Something we tend to overlook is to recognise the ‘prior knowledge’ of our teachers. Every educator will have developed a theory – based upon their understanding and experience – as to the greatest influences on learning in their classroom. Ask staff also to reflect upon their own teaching and learning values and beliefs. We have found it helpful to express the learning and teaching philosophy as a set of (documented) principles.
To define the philosophy, ask staff to brainstorm their key learning and teaching beliefs, concepts and principles. This can be achieved by every staff member providing their input to the process by writing down their individual ideas as statements on sticky notes – one statement per sticky note.
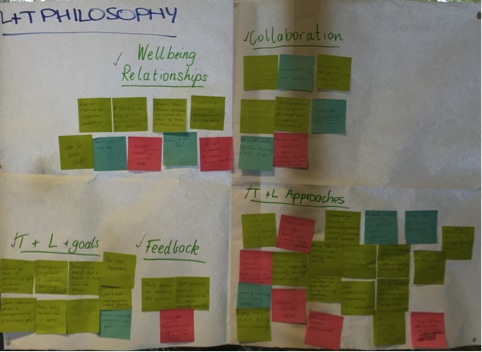
Step 3. Collate the ideas using an Affinity Diagram
The staff input can then be collated by creating an Affinity Diagram with the sticky notes. Headings are applied to the Affinity Diagram reflecting the agreed major themes (as in the figure below).
Affinity Diagram – theming ideas for a learning theory
Step 4. Agree theory statements
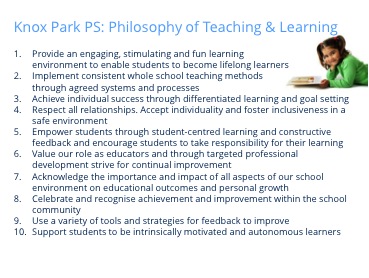
These themes can be documented as a set of agreed statements (principles). For example, the following are the principles of learning and teaching agreed to by Knox Primary School in Melbourne, Victoria.
Knox Park Primary School, Victoria Learning and Teaching Philosophy
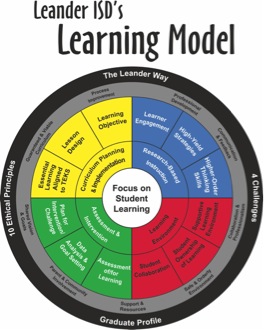
Here is another example of an agreed learning and teaching philosophy. It is the Learning Model developed by the Leander Independent Schools District in Texas, USA.
Leander Independent Schools District, Texas, USA Learning Model
The theory as a foundation for continual improvement
The school’s theory of learning and teaching, or principles, are then used as an ongoing reference to develop, review and continually improve consistency in policy and practice across the school. Each principle is subject to ongoing exploration through reflection and dialogue to develop deeper and shared understanding, and to inform the development of agreed learning systems and processes – the school’s pedagogical framework.
Naturally, the philosophy is dynamic. Like any theory or hypothesis, to be relevant and effective in an ongoing way, it will need to be regularly reviewed, reaffirmed or reinformed by further research and our experiences of applying it over time.
A final note
John Hattie’s research (Teachers Make a Difference: What is the research evidence? Australian Council for Educational Research, October 2003) revealed greater variation between the classrooms in an Australian school than between Australian schools. Defining the theory that will guide teaching and learning across your school is a way to reduce this variation.
Continual improvement is derived, in large measure, from the efforts of individuals and teams working together to bring about improvement. For example, many schools have introduced professional learning teams (PLTs). PLTs usually involve teams of teachers working together on agreed improvement projects aimed at improving classroom learning and teaching practice.
Sadly, ‘how’ we work on these improvement efforts is frequently left to chance. The result is valuable time and effort wasted as sub-optimal solutions are derived. So how can we make the most of these rich opportunities to improve?
The answer lies in applying a scientific approach to our improvement efforts – a structured learning and improvement process. Many know this as action learning or action research. We call it PDSA: the Plan-Do-Study-Act improvement cycle.
The history of PDSA
The PDSA cycle is attributed to the work of Walter Shewhart, a statistician working with the Bell Telephone Laboratories in New York during the 1930s (although it can be traced back further to John Dewey’s profound writings on education in the 1800’s).
Shewhart was the first to conceptualise the three steps of manufacturing — specification, production, and inspection – as a circle, rather than a straight line. He observed that when seeking to control or improve quality, there must be reflection upon the outcomes achieved (inspection) and adjustments made to the specifications and production process.
He proposed the move from this:
Figure 1. The linear process of specification, production and inspection
To this:
Figure 2. The cycle of specification, production and inspection
You may notice similarities with the traditional teaching methods of plan, teach, and assess.
Figure 3. The linear approach to Plan, Teach, Assess
In recent times there has been a focus in schools on “assessment for learning” (in contrast to “assessment of learning”). It parallels Shewhart’s observation of the need to close the loop in manufacturing.
Shewhart went on to identify the three steps of manufacturing as corresponding to the three steps of the dynamic scientific process of acquiring knowledge: making a hypothesis (or theory), carrying out an experiment, and testing the hypothesis (see Figure 4).
Figure 4. The three steps of acquiring knowledge
Source: Adapted from Walter Shewhart, 1986, Statistical Method from the Viewpoint of Quality Control, Dover, New York, p. 45.
With these thoughts, Shewhart planted the seeds for W. Edwards Deming to develop the Plan-Do-Check-Act cycle, which was published as the Shewhart cycle in 1982. Deming taught the Shewhart cycle to the Japanese from 1950 who picked it up and renamed it the Deming Cycle.
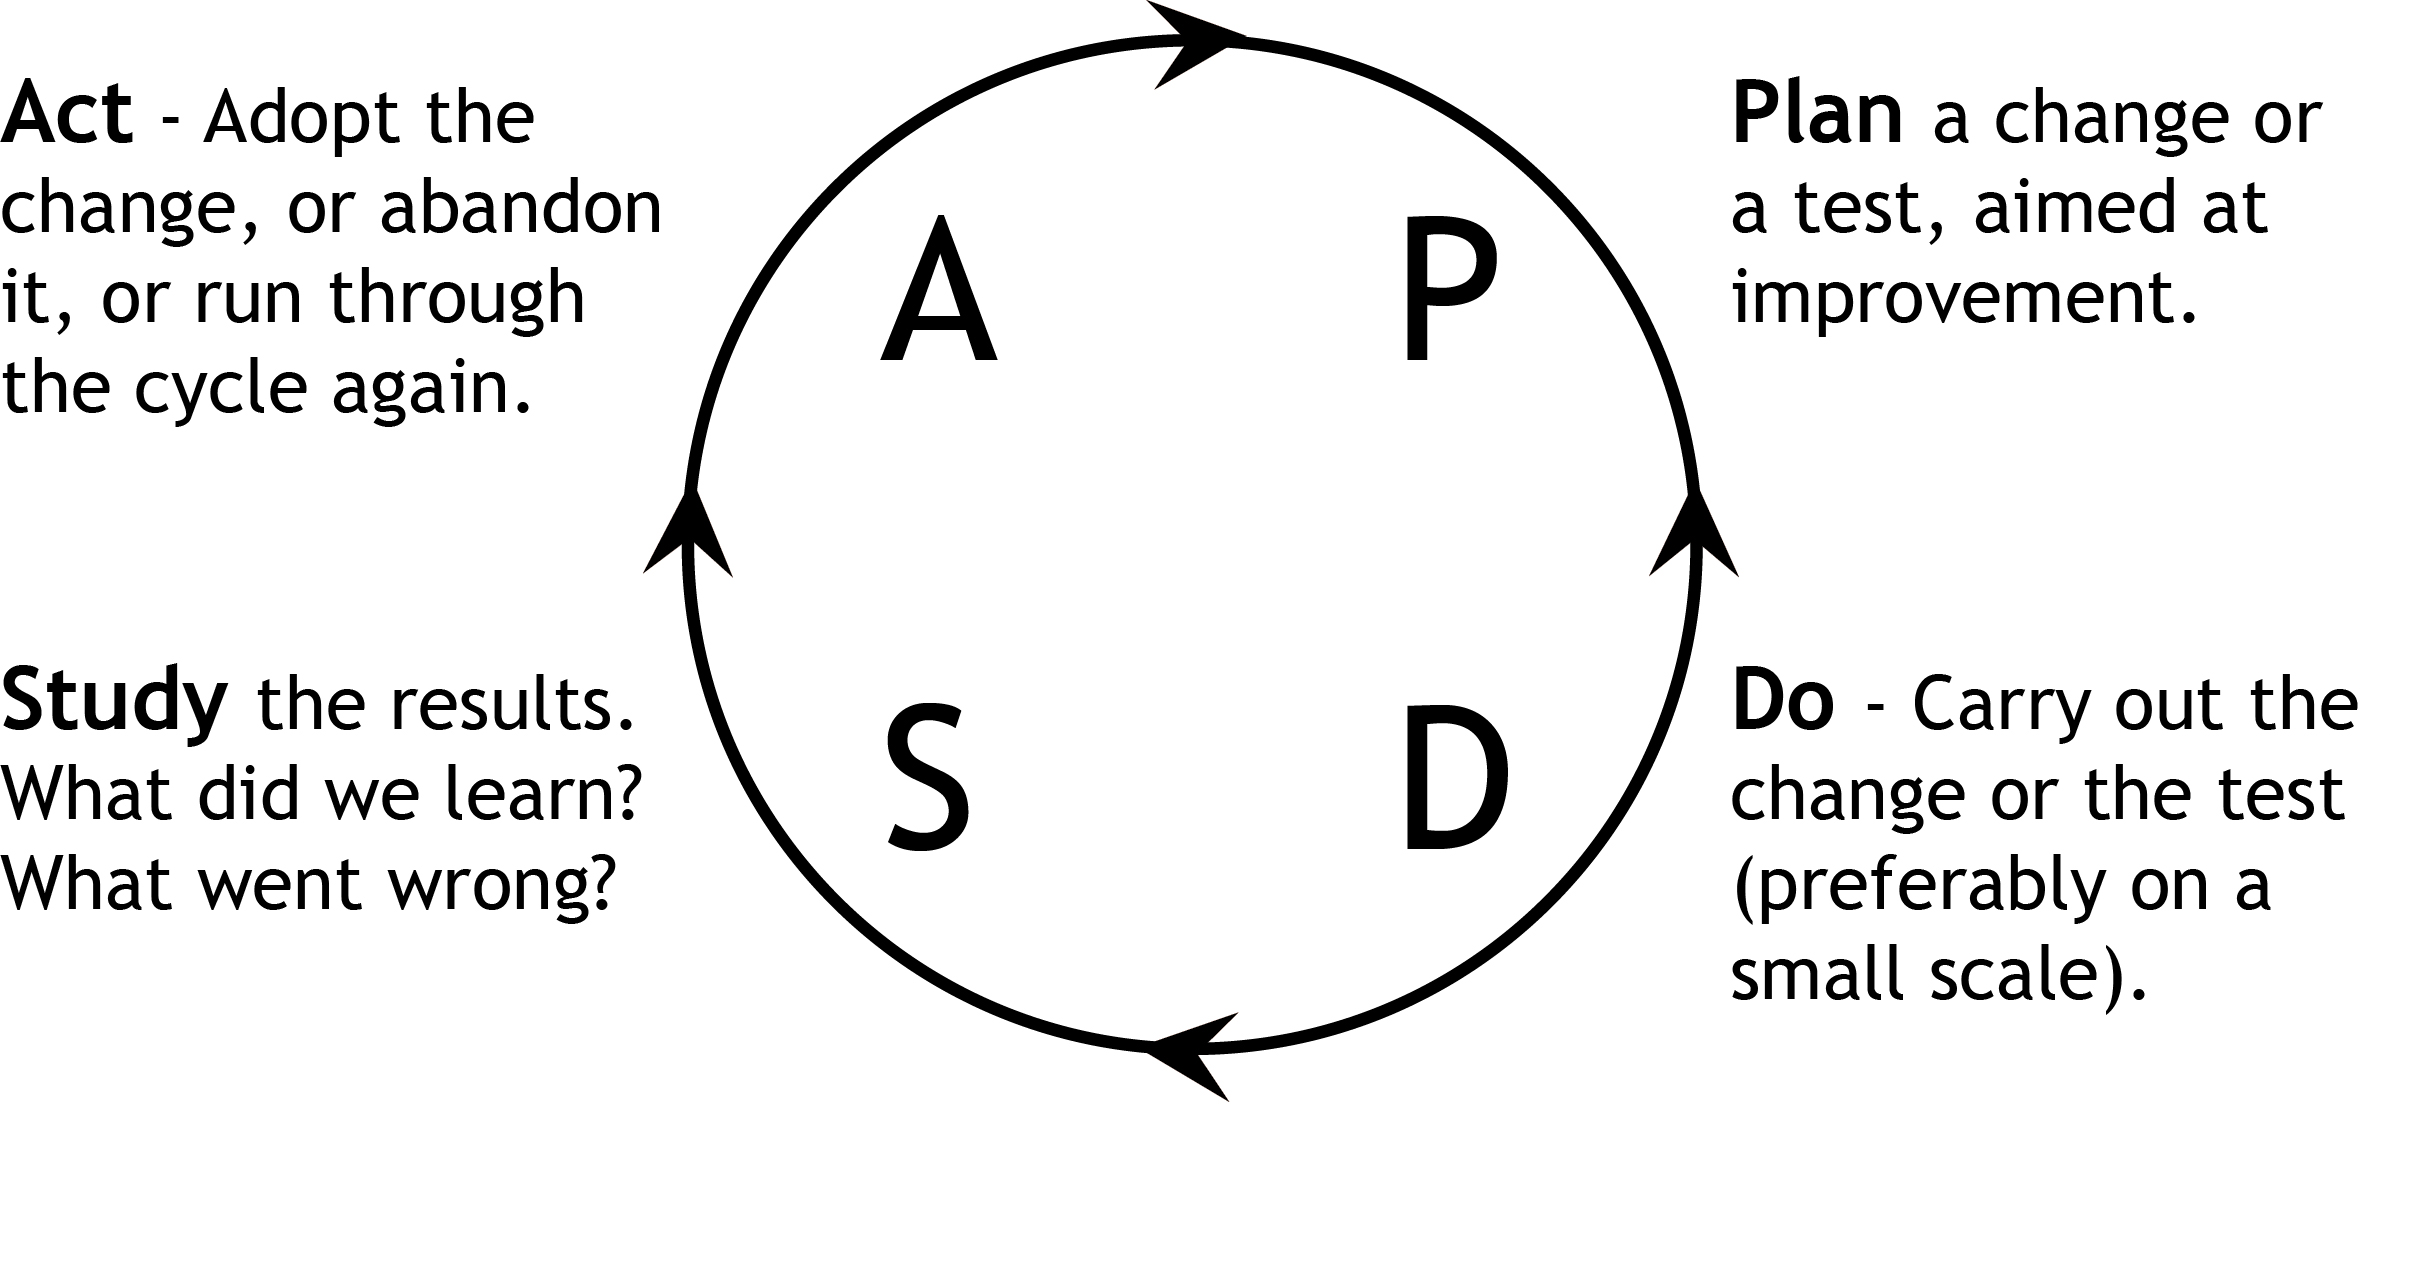
The PDSA Cycle
Deming published the cycle in The New Economics in 1993, as the Plan–Do–Study–Act (PDSA) cycle. He changed “check” to “study” in order to more accurately describe the action taken during this step. PDSA is the name by which the cycle has become widely known in recent times. (Figure 5.)
Figure 5. The Deming Cycle
Source: W. Edwards Deming, 1993, The New Economics: For industry, government, education, MIT, Cambridge.
The Plan-Do-Study-Act cycle is a structured process for improvement based on a cycle of theory, prediction, observation, and reflection.
There are, of course, many variants of the improvement process, with many and varied names. In overview, the concepts are the same.
There is a strong tendency for people to want to race through the “plan” stage and get straight into the “do” stage. Schools in particular find it difficult to make time for the reflective step of “study”. Many individuals and teams just want to get into the action and be seen to be making changes, rather than reflecting on whether the change has been an improvement, or just a change.
A detailed and structured process
Where an improvement opportunity is of a significantly complex nature, a comprehensive application of the PDSA process is necessary.
Our work in industry, government and education over the past two decades has shown the nine step PDSA process, illustrated in Figure 6, to be particularly effective. This nine step process has been compared with dozens of alternate models of PDSA and refined over the past two decades.
Figure 6. A nine step PDSA process
In developing such a process, there is a balance to be struck between the technical considerations of having a robust process that will deal with diverse contexts and issues, and the simplicity that makes the improvement process accessible and practical for busy people. Over the years, we have continually sought to simplify the model to make it more accessible. For nearly a decade, the nine steps have remained constant, but the specific actions and tools comprising each step have been progressively refined.
The process has beed designed to ensure it meets the criteria necessary to achieve sustainable improvement, namely:
Be clear about mutually agreed purpose
Establish a shared vision of excellence
Focus upon improving systems, processes and methods (rather than blaming individuals or just doing things)
Identify the root causes of dissatisfaction, not the symptoms
Carefully consider the systemic factors driving and restraining improvement, including interaction effects within the system and with containing systems
Identify strengths to build upon as well as deficiencies to be addressed
Identify the clients of the improvement efforts and understand their needs and expectations
Achieve a balance in addressing the competing, and sometimes contradictory, needs and expectations of stakeholders in improvement efforts
Be clear about the theory for improvement, and use this to predict outcomes
Reflect on the outcomes of improvement efforts, in the context of the selected theory for improvement, in order to refine the theory for improvement
Use operational definitions to ensure clarity of understanding and measurement
Not copy others’ practices without adequate reflection about their proper implementation in a new context — adapt not adopt.
These requirements have been reflected in the nine step PDSA improvement process shown in Figure 6.
To provide clear guidance, we have developed a comprehensive PDSA chart (Figure 7). The PDSA improvement process is framed as a series of questions to be answered by the improvement team (or individual). These questions address the considerations necessary to achieve sustainable improvement as detailed above. The process also refers the user to specific quality learning tools that can be used to address the questions, promoting collaboration and evidence-based decision-making.
Future 7. A detailed nine-step PDSA cycle
This is not a perfect process for improvement — there is no such thing. It is a process for improvement that can be adapted (not adopted), applied, studied, and improved. It can be used as a starting point for others, like you, who may wish to create a process of their own.
There are enormous benefits to applying a standard improvement process: an agreed improvement process that everybody follows. This can be standard across the school or whole district. Everyone can use the same approach, from students to superintendent. The benefits, apart from maximising the return on effort, time and resources, include having a common and widely used model, language, set of concepts, and agreed tools. It also establishes an agreed process that can itself be reviewed and improved, with the contribution of everybody in the organisation.
Quality learning provides administrators, educators, and students with the thinking and practical quality improvement tools necessary to continually improve schools, classrooms and learning. The Consensogram is one of these powerful and easy-to-use quality improvement tools.
A consensogram
The Consensogram facilitates collaboration to support planning and decision making through the collection and display of data. It can be used to gain important insights into the perceptions of stakeholders (most often relating to their level of commitment, effort, or understanding).
The quick-to-construct chart reveals the frequency and distribution of responses. Although anonymous, it allows individuals to view their response in relation to the others in the group.
The Consensogram gives voice to the silent majorityand perspective to the vocal minority.
At QLA, we use frequently use the Consensogram: applying it to diverse situations for the purpose of obtaining important data to better inform ‘where to next’.
How to
Predetermine the question relating to the data to be collected. Make sure the question is seeking a personalised response – it contains an “I” or “my” or “me”. We want people to give their view. E.g. “To what degree am I committed to…” or “To what degree do I understand…” It can help to begin the question with ‘To what degree…’
Predetermine the scale you wish to use. The scale may be zero to 10 or a percentage scale between zero and 100 percent.
Issue each person with one sticky note. Make sure the sticky notes are all the same size. Colour is not important.
Explain that you want people to write a number on their sticky note in response to the question posed.
No negative numbers.
If using the zero to 10 scale: the number should be a whole number (not a fraction e.g. 3¾ or 3.75, 55%), and a six or nine should be underlined so they can be distinguished.
If using the zero to 100% scale, the numbers should be multiples of ten percent, i.e. 0%, 10%, 20%, and so on.
Names are not required on the sticky notes.
Ask people to write down their response. This shouldn’t take long!
Collect the sticky notes and construct the Consensogram, usually on flip chart paper. Label the consensogram with the question and a vertical axis showing the scale.
Interpret the Consensogram with the group and use it to inform what to do next.
Capture a record of your Consensogram by taking a photograph or saving the data on a spreadsheet. You can use a Consensogram template.
Some examples
Students feeling prepared for high school
Consensogram: students feeling prepared for high school
This first example was prepared by a classroom teacher to determine how confident Year 6 students were feeling about their transitioning to high school.
So what do the data reveal?
There is significant variation; the students believe they are prepared to different degrees for their move to high school (scores range from 10 to 4).
There is one outlier (special cause) – that is; one student who is having a very different experience to others in the class (giving a rating of one). They report that they feel unprepared for the transition.
So where to next?
There is opportunity to improve student confidence by working with the whole class to identify and work together to eliminate or minimise the biggest barriers to their feeling prepared.
There is opportunity to invite the student who is feeling unprepared to work with the teacher one-on-one (case manage) to address their specific needs for transiting. This student should not be singled out in front of the class, but an invitation issued to the whole class for that individual to have a quiet word with the teacher at a convenient time. The ensuing discussion may also inform the transitioning process for the rest of the class.
Student engagement
This example was created during a QLA professional development
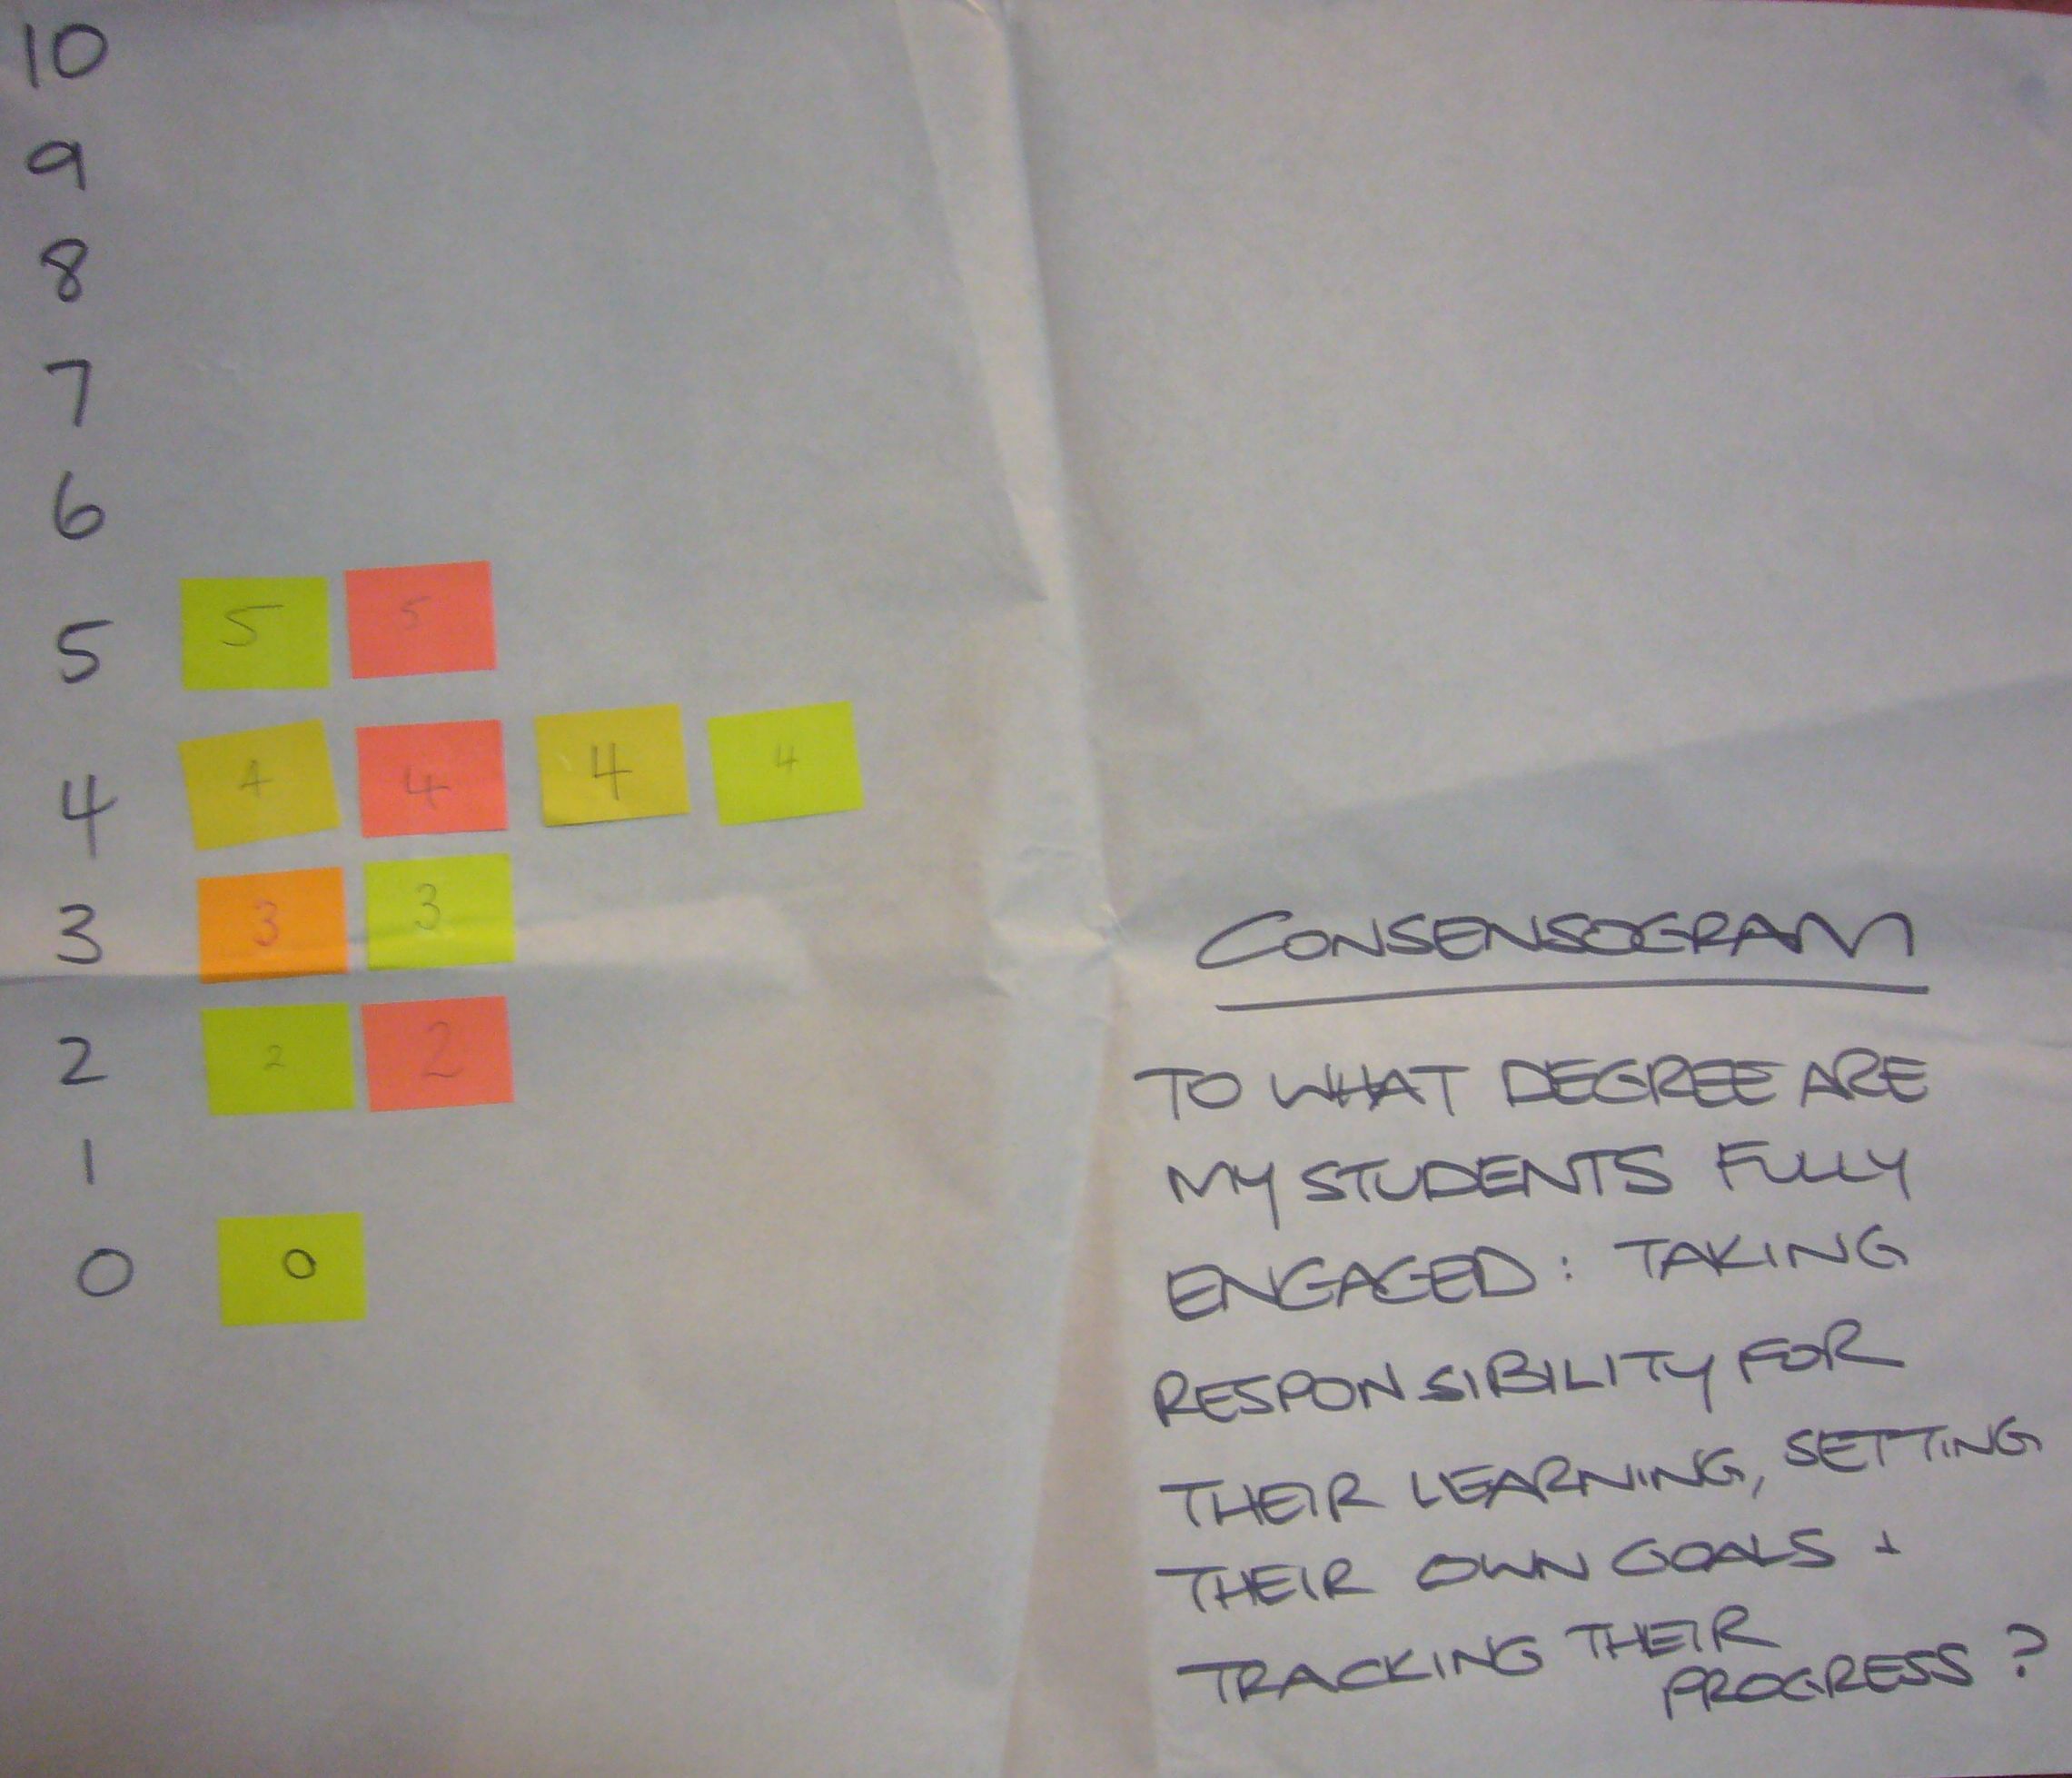
Consensogram: how engaged are students in my classroom?
workshop with a small group of 11 teachers.
The question was: “To what degree are my students fully engaged: taking responsibility for their learning, setting their own goals and tracking their progress?”
So what do the data reveal?
There is variation; the teachers believe their students are at different levels of engagement in their classroom.
The data appears normally distributed data (a bell curve); there are no outliers (special causes) – that is; none of the teachers are having a very different experience to others in the group.
So where to next?
There is opportunity to improve student engagement; all of the data points are below 5 on the scale.
This data can help the group to understand the agreed current state and can motivate people to engage with improvement. It can also provide baseline data to monitor the impact of improvement efforts in the future.
Commitment to school purpose
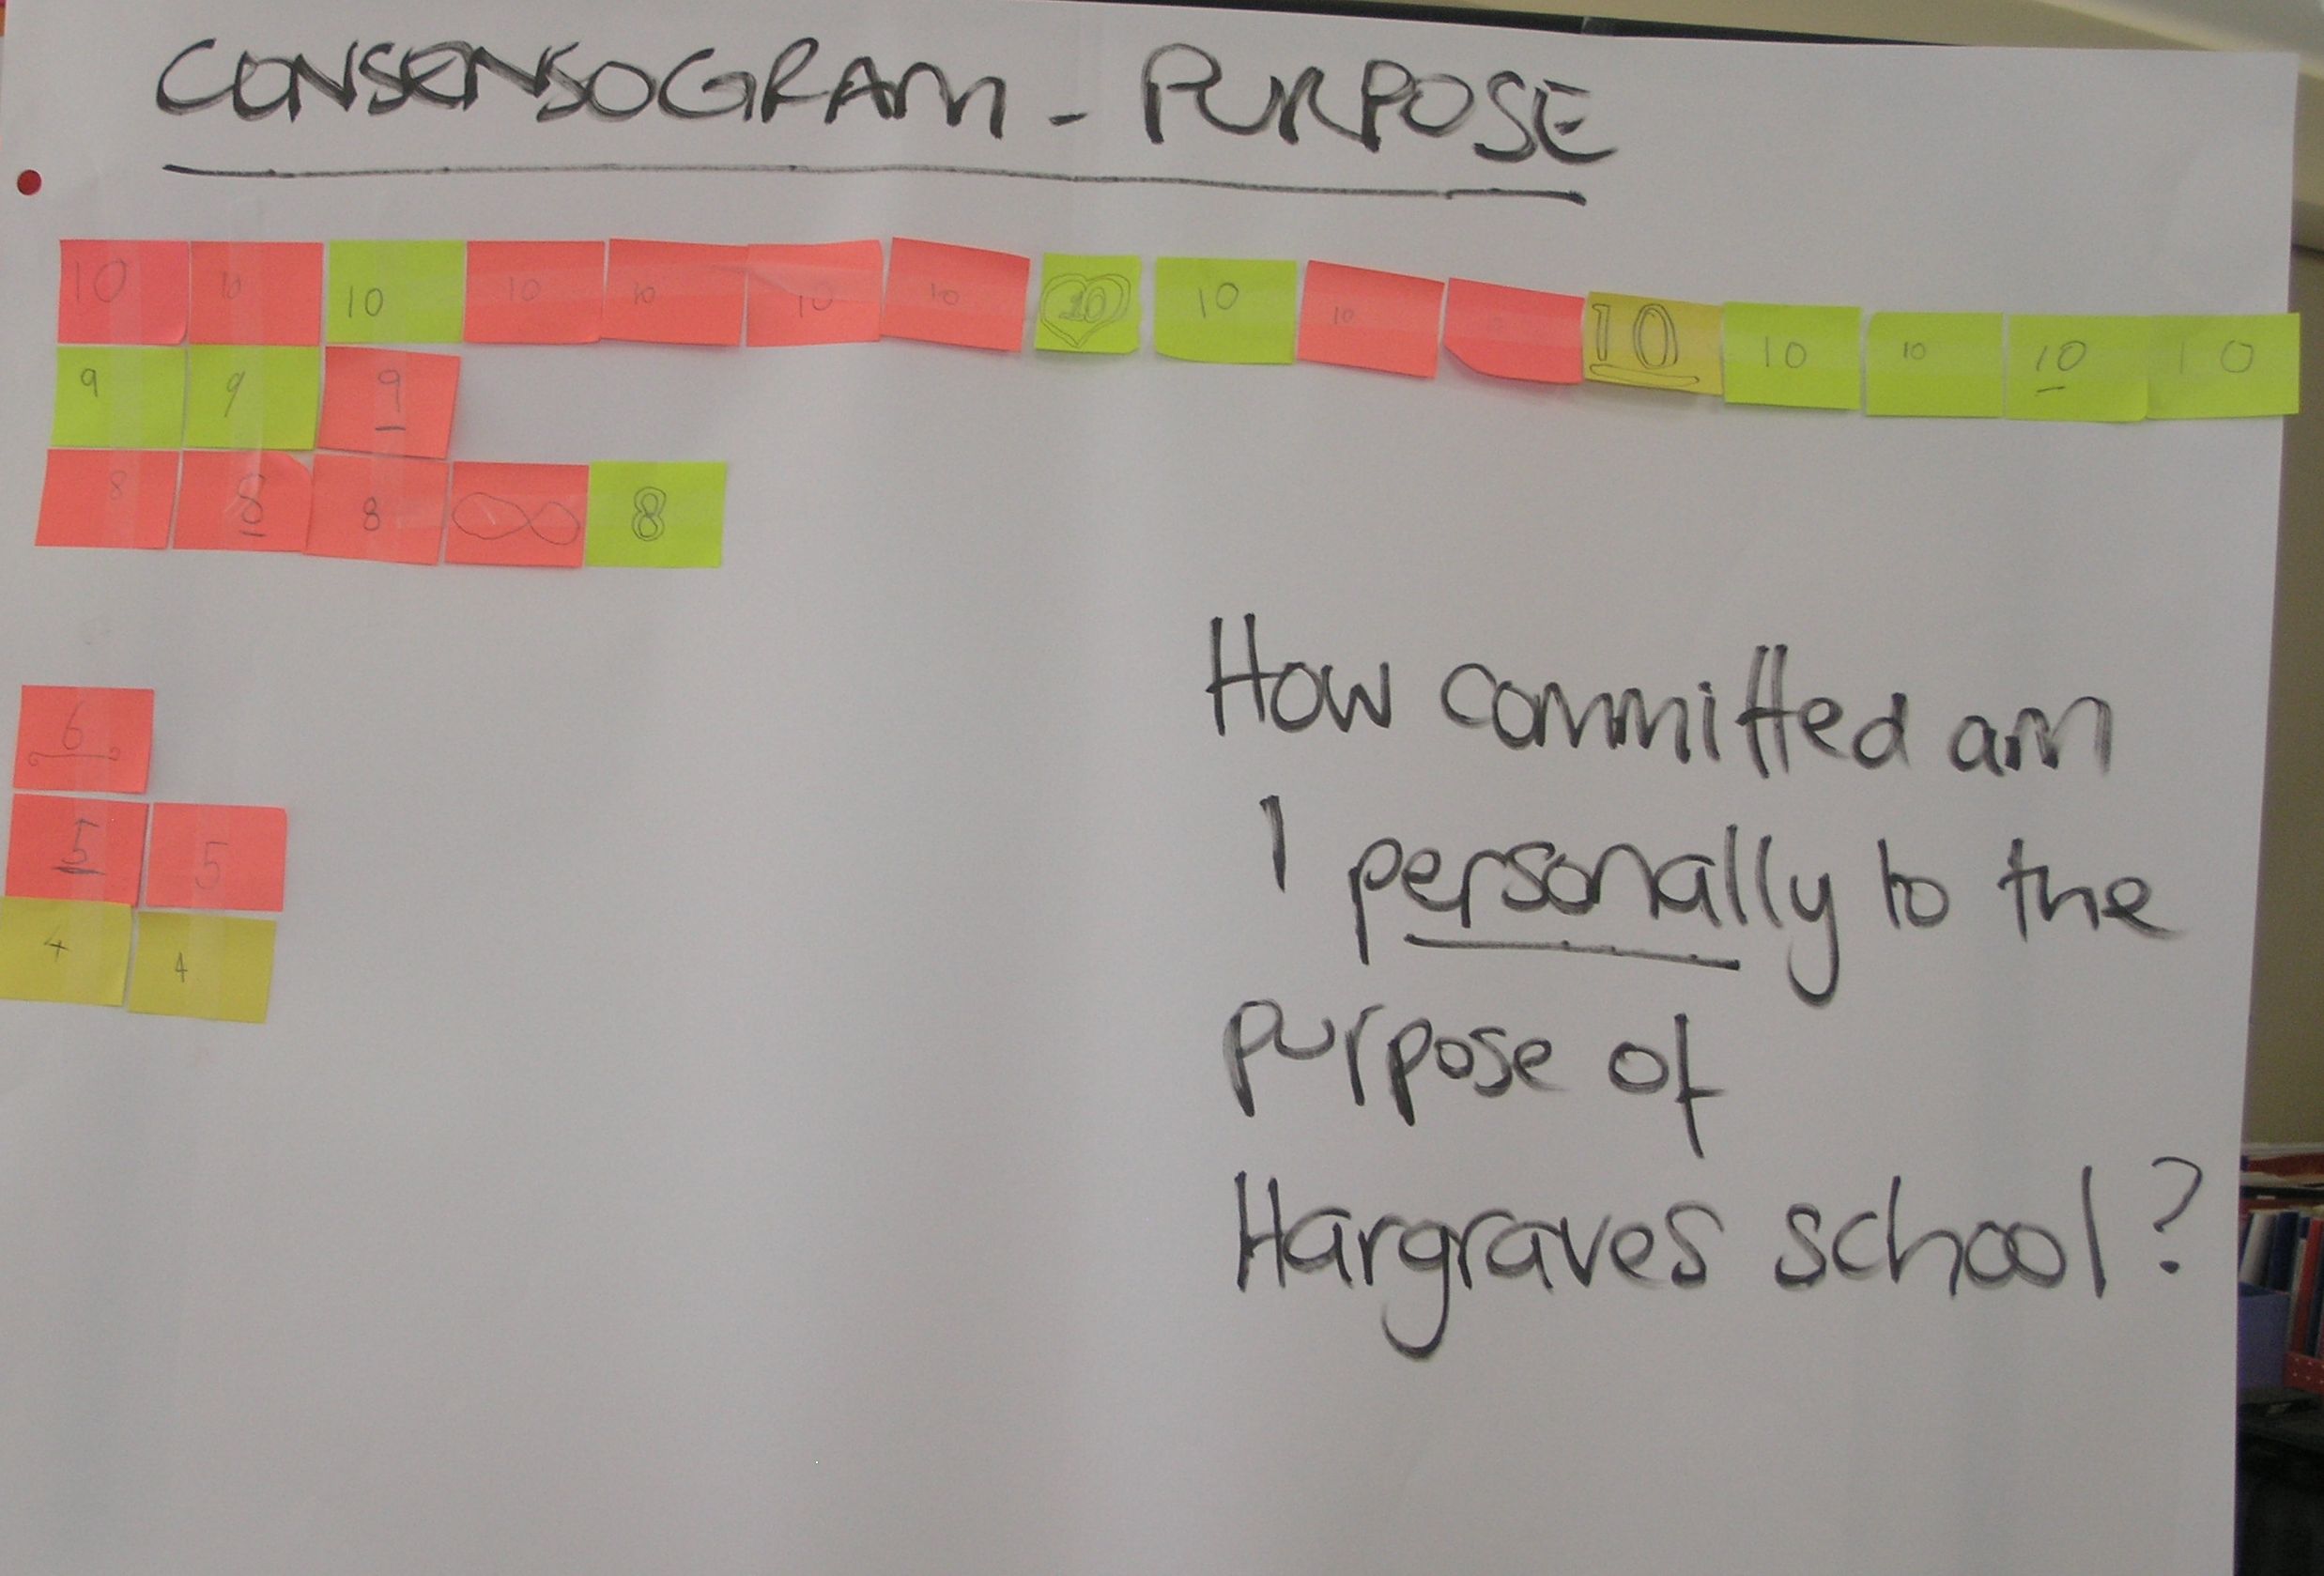
This example was created during school strategic planning with key stakeholders of a small school (parents, staff and students). A draft
Consensogram: how committed am I to our school purpose?
purpose statement was developed using stakeholder input (using a P3T Tool). The Consensogram was then used to measure the level of commitment to the draft statement. The question was: “How committed am I personally to the purpose of the school?”
The use of the Consensogram averted the need for long, frequently unproductive dialogue. It revealed the following:
There is variation; the stakeholders exhibit different levels of commitment to the school purpose.
Most are stakeholders are highly committed (the majority indicating a commitment level of 8-10).
A group of five stakeholders are less committed (a commitment level of 4-6). Their experience may be different to others in the group.
So where to next?
This presents an opportunity to invite the stakeholders with a different experience to share. It is very likely something can be learned to improve the purpose statement for everyone.
Learn more…
Watch a video example of a Consensogram being used for school planning (Hargraves System Mapping) on YouTube.
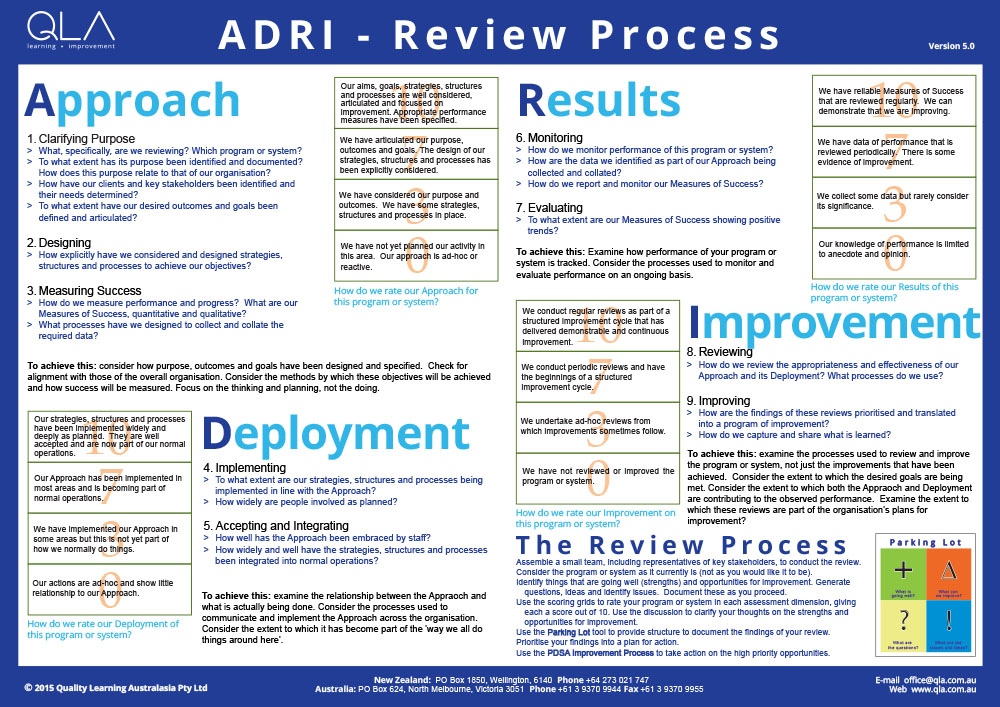
The assessment dimensions of Approach-Deployment-Results-Improvement (ADRI) can be very helpful for self-assessment. ADRI provides a structure under which the activities and results of an organisation can be broken down to identify, quite specifically, where the strengths and opportunities for improvement may lie.
ADRI provides a structured approach to organisational self-assessment. The ADRI dimensions help you to analyse how your organisation goes about: thinking and planning (Approach); implementing and doing (Deployment); monitoring and evaluating (Results); and reviewing and improving (Improvement).
It is a feature of the Australian Business Excellence framework and underpins many other performance excellence frameworks around the world.
ADRI Review Process Poster for Self-assessment
Source: Adapted by QLA from the Australian Business Excellence Framework, the Malcolm Baldrige National Quality Awards Criteria and the European Foundation for Quality Management Excellence Model.
The ADRI assessment dimensions
Approach
Approach relates to the thinking and planning behind the area of endeavour – how it has been designed.
Considering an Approach leads to an examination of:
clarity of purpose
clients, key stakeholders and their respective needs
desired outcomes – the vision of excellence
design of strategies, structures and processes to meet the desired outcomes
identification of measures of success.
In most organisations the senior leaders, sometimes with the support of content specialists, determine the approach.
For example, senior leaders of a school, frequently with the help of a specialist curriculum committee, usually lead the approach to curriculum. It is the responsibility of these leaders to identify and make clear the purpose of curriculum in the school, the desired curriculum outcomes for the school, and to understand the needs of key stakeholders (including teachers, families and curriculum regulatory bodies). Armed with this understanding, the structures and processes (including documentation) necessary to meet the intentions of the school can be designed. It is during the design stage that the measures of success are also determined from the desired outcomes (the vision of excellence): what data will be used to monitor progress over time? Senior leaders do the thinking and planning – the design.
Deployment
Deployment relates to implementing and doing – how the design is put into effect.
Considering Deployment leads to an examination of:
the degree to which the designed strategies, structures and processes have been implemented across the organisation and down through the organisation
the extent to which staff understand and have embraced the organisation’s approach
how well the strategies, structures and processes have been integrated into the day-to-day operation of the organisation.
Those doing the daily work know most about how the daily work is done. Those that are expected to implement an organisation’s approach know most about it has been deployed. The school curriculum committee may have designed an excellent approach, but it is up to each classroom teacher to implement it. If classroom teachers are not adhering to the agreed school curriculum approach, it has not been deployed well.
Results
Results relates to monitoring and evaluating – how success is gauged.
Considering the Results dimension leads to an examination of:
how performance is monitored
how the data relating to the measures of success (determined as part of the Approach) are collected, collated and reported
the degree to which trends of improvement are evident in these data.
Monitoring and evaluating is a management responsibility. School leaders are responsible for monitoring and evaluating the data used as measures of success for their approach to curriculum. Unless these data are collected, collated and reported, the effectiveness of the approach and its deployment will be unknown.
Improvement
Improvement relates to the processes of reviewing and improving the approach and its deployment.
Considering the Improvement dimension leads to an examination of:
the process by which the appropriateness and effectiveness of the approach and its deployment are reviewed
how these reviews have led to improvement
how the lessons learned are captured and shared.
Improvement is a management responsibility. Continuing the school curriculum example, a school’s senior leaders are expected to regularly review and refine the school’s curriculum. This assessment dimension examines the process by which that is undertaken, the improvements that have resulted and how these improvements are documented and shared with staff and other key stakeholders.
Why ADRI is useful
The assessment dimensions are useful for two purposes: diagnosis and design.
Diagnosis
When something is not working well in an organisation, ADRI provides a lens for examining activities and results to determine why it isn’t working and then to determine what to do about it.
When things aren’t going well, it could be because:
the Approach is weak
the Deployment is poor.
If the approach is weak, attention must be paid to reviewing and improving the design. Deploying a poor approach will not deliver good results.
A sound approach, poorly deployed, will not deliver good results either. If the approach is well thought through but is not being applied, then attention needs to be paid to ensuring people know about and implement the agreed approach.
Note that these two causes – a weak approach and poor deployment – have the same effect: disappointing results. Yet the actions required to address the disappointing results are quite different. ADRI can assist in determining which cause is more significant.
For example, a school may identify parent dissatisfaction with student reports. Firstly, knowledge of ADRI would lead the school leadership team to seek clarity and reflect upon the school’s design for assessment and reporting. Which assessments are to be undertaken? What is the schedule? What is the agreed process for reporting? Is the approach appropriate? These are questions regarding the approach. Secondly, they would explore the extent to which the approach is being applied in practice. Do staff understand and follow the agreed procedures? Are timelines being met? These are questions regarding deployment. Actions required to address parent dissatisfaction will be quite different depending where the opportunities for improvement lie: in the approach, or more to do with deployment.
Design
ADRI is also useful when designing organisation’s systems, structures and processes. In thinking about how to pursue any area of endeavour, ADRI provides useful guidance to ensure key considerations are not overlooked. If you look back over the considerations associated with each of the dimensions, you can easily identify key questions to be answered when determining how to design processes that will achieve an organisation’s goals. These questions could include:
Have we clearly articulated our purpose, desired outcomes and a vision of excellence?
What are the needs of our clients and key stakeholders?
What strategies, structures and processes are required to achieve our aspirations?
What data do we need to measure effectiveness and track progress over time? How will these data be collected, collated and regularly reported?
How will we document, train and coach people to adopt the new approach?
How will we monitor the acceptance and application of the new approach?
How will ongoing performance data be monitored and evaluated?
What is the cycle of review and improvement for this approach and its deployment?
How to use ADRI
The assessment dimensions of ADRI can be used in many ways. Typically, they are used as:
a checklist for reflecting upon the activities and results of an organisation
a framework for describing the activities and results of an organisation
an assessment model to evaluate the activities and results of an organisation.
ADRI is commonly used as a checklist to think about what is happening in an organisation. For example, thinking about whether observed difficulties are due to a deficient approach or poor deployment is a common application.
ADRI can provide a structure for describing how an organisation goes about its business. This use of ADRI is common in performance excellence awards processes such as those based on the Australian Business Excellence Awards, the Malcolm Baldrige National Quality Awards in the USA, and those of the European Foundation for Quality Management. Organisations describe explicitly how they go about each assessment dimension for each area of endeavour. The areas described are usually the categories or items of these specific frameworks (for example, Leadership, Strategy and Planning, Customers and Other Stakeholders). The use of ADRI in this way is applicable to any area of organisational activity.
A school (or district) could use ADRI as a structure to describe any program, initiative, project or other area of endeavour. For example; a district could document its thinking and planning (approach) to community engagement, how that has been implemented across the district (deployment), how data demonstrate effectiveness in community engagement (results), and the process by which the district reviews and improves community engagement (improvement). The act of documenting the activities and results in this structure usually leads to the identification of strengths and areas of opportunity for improvement.
ADRI can also be used to evaluate or rate the organisation’s activities and results. The figureabove, ADRI Review Process Poster for Self-assessment, which you can download free of charge from our website, provides a structure for such an evaluation. Each of the four dimensions, ADRI, is evaluated and given a rating, which leads to identification of strengths and opportunities for improvement.
How does ADRI relate to PDSA?
The Plan-Do-Study-Act (PDSA) cycle, provides a step-by-step process to bring about improvement over time. ADRI provides specific dimensions to reflect upon the activities and results of an organisation at a specific point in time.
Both PDSA and ADRI are based on the learning and improvement cycle, also known as scientific method and action research. PDSA provides a method for realising improvement. ADRI provides a structure for identifying where improvement may be required.
Many schools are currently promoting ‘student voice’ – a feature of many school improvement models. However our experience shows that this rarely extends beyond a Student Representative Council where a few selected students have the responsibility to collect periodic feedback from students or engage with school fundraising activities. This is a limited view of student voice.
Quality Learning theory emphasises the importance of working together to improve and involving the ‘worker at the front line’ in improving the system. In schools this is the student.
Student contribution begins in the classroom
Students’ potential to lead improvement begins in the classroom. Every student can reflect upon what helps him or her to learn and what hinders learning. Students, with their teacher, can use Quality Learning tools to share, explore and prioritise these driving and restraining forces. A Parking Lot is a good way to collect this data on an ongoing basis. (See our previous blog post Put up a Parking Lot!)
John Hattie in his book Visible Learning (2009) discusses feedback as in the ‘top 10’ greatest influences on student learning. He emphasises the importance of of student-to-teacher feedback (not just the more commonplace teacher-to-student kind).
Based on considered student feedback, teachers and students can jointly design and trial changes to classroomprocesses, with the aim of improving learning. The class can evaluate the effectiveness of these changes over time. The changes can then be:
Plan-Do-Study-Act Cycle, as described by Dr W Edwards Deming
Engaging students in classroom improvement like this has four key benefits.
Teachers can learn a great deal from listening to their students discuss what helps and hinders their learning. This also develops student metacognition and builds capacity in ‘learning how to learn’.
Engaging students in the PDSA cycle of improvement teaches them a practical ‘how to’ approach to improvement, which they can then apply to their own opportunities for improvement. These lessons have practical application beyond schooling.
Engaging students in improving their own situation builds student ownership of the process and outcomes. The teacher has the active support of students in developing, trialling and evaluating a jointly developed theory for improvement.
If the trial is successful, student learning will improve. If it is not successful, students have benefited from experience with the PDSA cycle. An alternative theory can be developed and trialled.
Student contribution to whole-school improvement
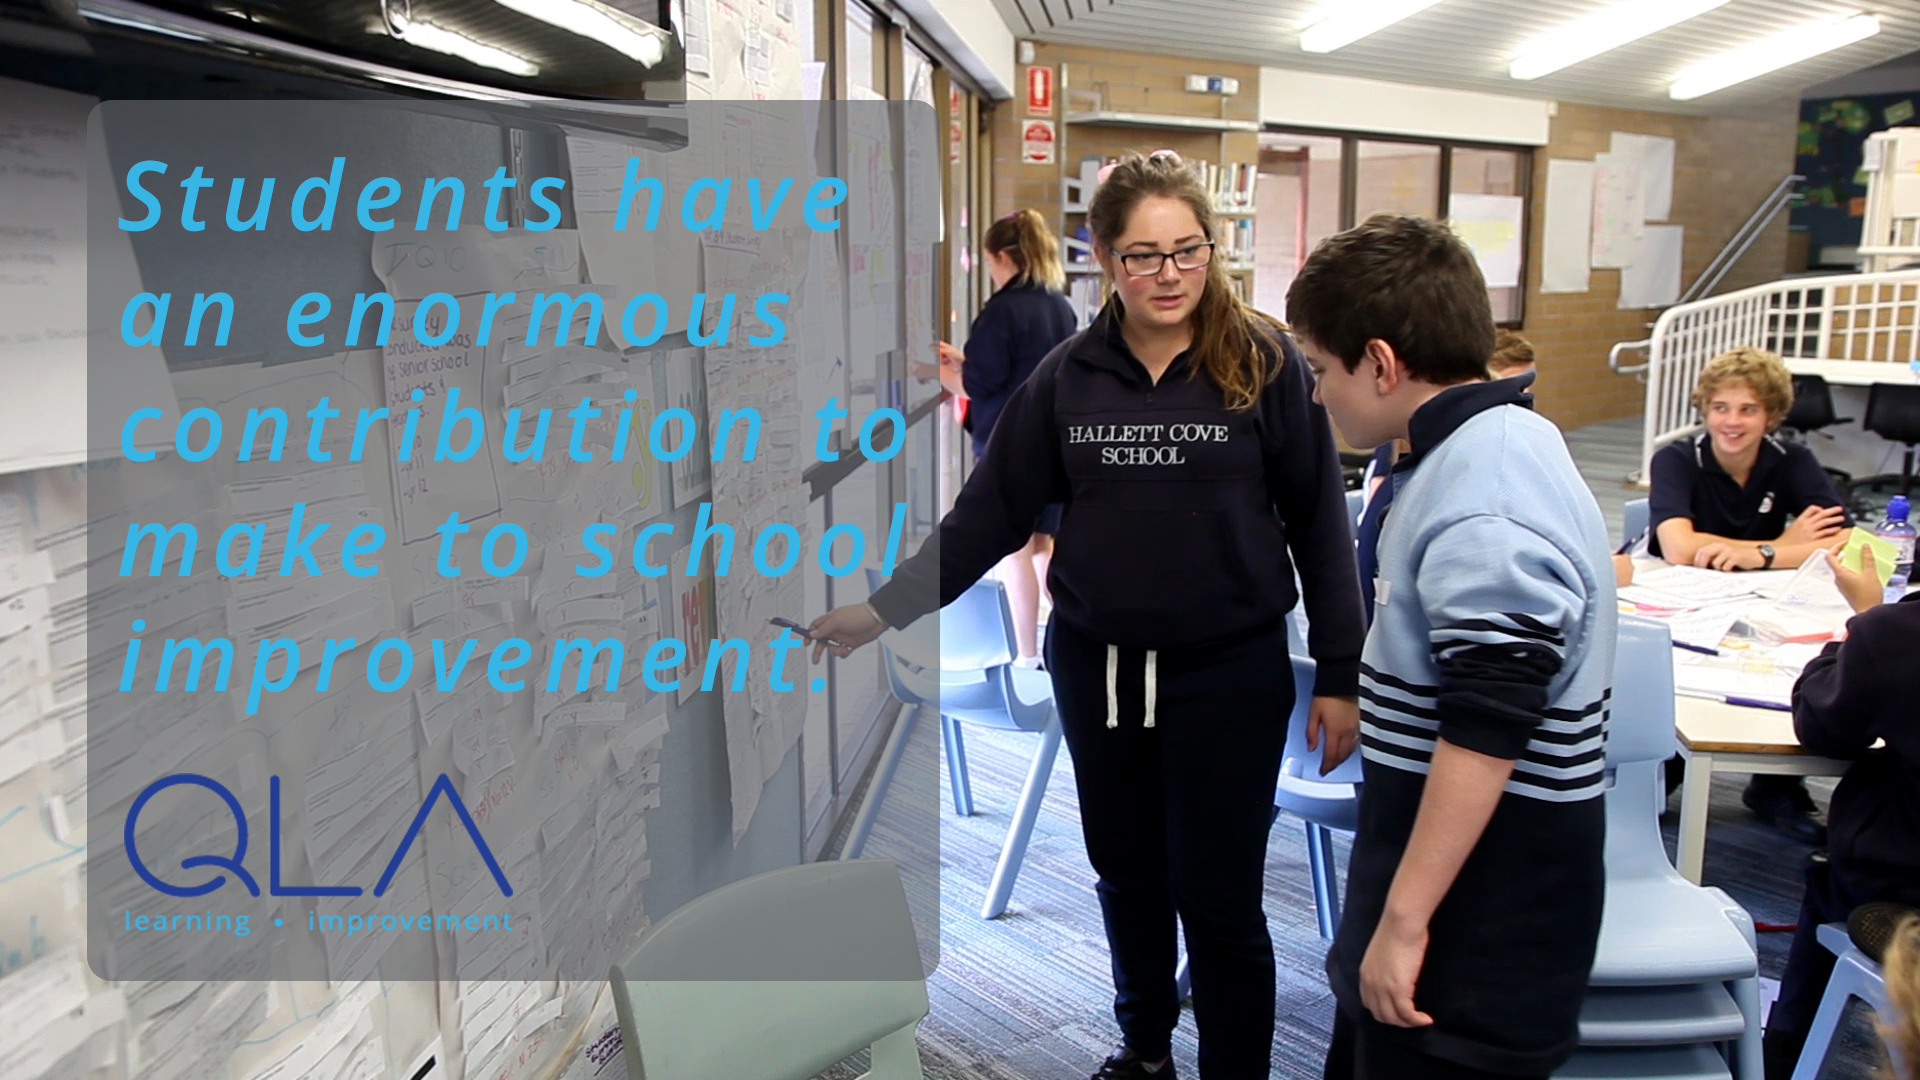
In addition to contributing to improving learning in the classroom, students have a significant contribution to make to whole-school improvement. In most schools, this potential remains unexplored, let alone realised.
There are many more students than adults (teachers, administrators and support staff) in most schools. While student-teacher ratios vary enormously by school type and sector, it is generally true that students outnumber adults by more than five to one in most schools. In some places, the ratio is more than ten to one.
The adult populations in schools are diverse; this is even more so for most student populations. There is a rich diversity of backgrounds, languages, cultures, experiences and skills in both the adult and student populations in all schools. This is more pronounced in some schools than others, but it is always present. (Such is the nature of variation in social systems).
Yet in most schools, school improvement is the domain of adults alone.
It doesn’t have to be this way.
The enormous potential of student creativity remains untapped in most schools. Young people have not yet learned some of the constrained thinking that we tend to acquire through life. Students can ask the obvious questions that we don’t even see and have ideas for improvement we could never dream of.
Hallett Cove R-12 School
Student Improvement Teams
Students can lead and participate in improvement teams to address key issues of concern. We have worked with student teams over many years on school, community and industry-based improvement projects. They have never failed to do a remarkable job.
Students from the Student Leadership Team at Hallett Cove R-12 School in South Australia recently participated in a rigorous process of school improvement using the PDSA cycle.
Ten teams were formed looking at issues that affected them within their school.
Student Improvement Teams from Hallett Cover R-12 School, South Australia
The objectives of the process were for students to:
Phase 2 was where the bulk of the work was done. Students analysed a school situation or process, using the PDSA cycle and Quality Learning tools, to understand the system, identify root causes, develop solutions and make recommendations. To do this the used the following process (and tools):
5.2 What are the recommendations for action, including time lines and responsibilities? (Gantt Chart)
5.3 How will the recommendations be communicated?
On the final afternoon, teams presented their findings to the school leadership team. The other Student Teams were also present. Their findings were presented as a written report and a presentation.
The Evaluation Meeting occurred in the days following the report presentation and provided an opportunity to give feedback to the school about their experience.
The many excellent recommendations were acted upon in the weeks that followed, and have made lasting and significant improvements to the school.
In the words of Andrew Gohl, Assistant Principal:
The PDSA cycle provides a structure and a clear process that people can work through, that is inclusive of all voices: regardless of whether you are the very young, the very old, the very vociferous, the very quiet. There’s a clear process there for everyone to have a voice, for everyone to be heard. And, of course, in that inclusiveness, the outcome is one which meets everybody’s needs.
Watch the video that tells the story of the Hallett Cove R-12 School Student Teams.
Over the past 15 years the conversations about school improvement have been changing.
Key observations about school improvement, which were not discussed at the turn of the millennium, are now clearly on the agenda.
However, there are still critical elements that are not yet part of this dialogue. This post reflects upon these important conversations.
What is being talked about
Items now on the agenda include:
The systemic nature of school systems. There is growing awareness of the interconnectedness that exists among the component parts of these complex social systems. These components need to work together if the system is to be optimised towards its aim.
Students’ learning as the aim, rather than teachers’ teaching. This may seem a pedantic distinction, yet it profoundly changes the emphasis in dialogue, and thereby the focus of improvement efforts: from educational policy right through to the classroom.
Our systems of school education are not meeting the needs of significant proportion of students. Not only is the system failing our more disadvantaged students, dissatisfaction is widespread and evident in the perceptions of students, teachers and families. Furthermore, in Australia at least, the performance of the education system has largely flat-lined over the past decade, in spite of significantly increased resources. There are pockets of excellence and dramatic improvement, but across the system improvement progress is glacial.
The use of data to inform improvement. With the development of national testing in Australia, and elsewhere, there is now systemic learning data that stimulates and informs conversations and debate. Like it or not, these data are here to stay, and they continue to inform the debate about school improvement.
The organisational improvement theory, derived primarily from the work of Dr. W Edwards Deming, leads directly to each of these observations. They have been part of our conversations with friends, clients and colleagues for over a decade. We are encouraged that the significance of these issues and opportunities is now recognised.
What is yet to be talked about
Improvement theory also points to other key opportunities that are not yet common in dialogue about school improvement.
Student contribution to school improvement
Students have a lot to contribute
It is only students who truly know what helps and hinders their learning.
Unless their insight is accessed, acknowledged and acted upon, attempts to improve learning are likely to be misguided. Furthermore, if all students are to benefit, this action needs to be taken regularly at the local level, in each and every classroom. Simple tools, such as the Parking Lot and Force-field Analysis, provide mechanisms that enable this from pre-school to senior high school levels.
Students can contribute significantly to improving the operation of the school.
Some schools emphasise ‘student voice’ through mechanisms such as Student Representative Councils and Student Leaders. These process, while important, are in no way sufficient. A much greater opportunity lies in having students skilled and experienced in leading and participating in improvement project teams. These teams can apply the Plan-Do-Study-Act learning cycle to directly address opportunities to improve the school. Not only does this approach build the capability of students to personally contribute to improvement (a capability that can be of great benefit to them in their future), it also builds student ownership of the school and classroom while relieving the burden on school leaders, administrators and teachers.
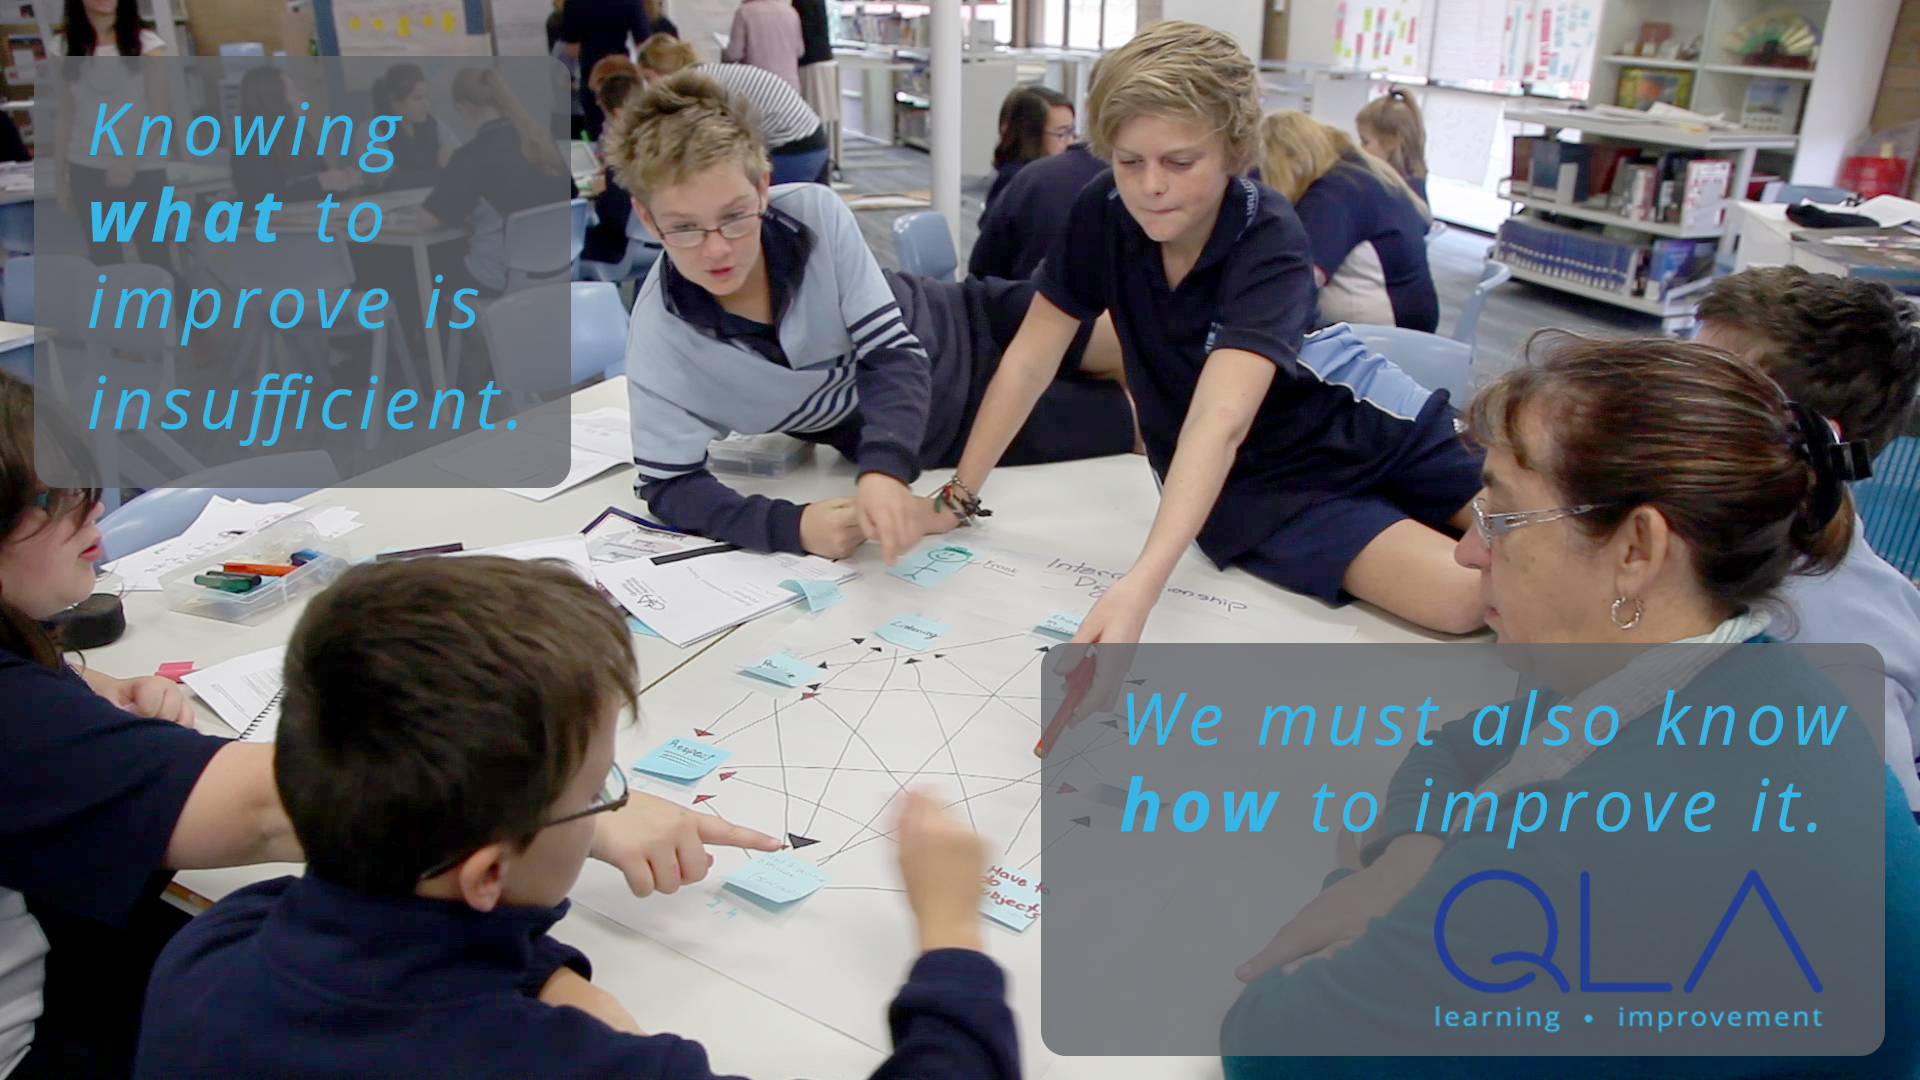
Too much what, not enough how
There is far too much discussion of what excellence in schools looks like, at the expense of how schools might achieve it.
Knowing what to improve is not sufficient. We must also know how to improve it. Copying others’ examples of good practice rarely delivers sustainable improvement. Schools can learn from others’ good practice, but each school must develop and test its own theory for improvement. The Plan-Do-Study-Act improvement cycle and the associated Quality Learning tools provide the ‘how to’ for developing and testing a theory for improvement.
These two observations, which remain to be discovered by leaders of the school improvement movement, hold the most significant promise for delivering demonstrable and continual school improvement.
Note: Our thanks to Hallett Cove R-12 School, South Australia, for the images, which were taken during QLA facilitated Student Improvement Team workshops in 2014.
Discussion
We would love to hear your views on this topic. What do you see missing from the dialogue about school improvement?