Dr W. Edwards Deming was adamant the people have a right to enjoy their work. They have a right to be treated with dignity and respect. Point 8 of his 14 points: Drive out fear.
Whether you are a school leader, classroom teacher, support staff member or student, you have a right to a fear free school. Easier said than done.
Systems and processes can create fear
The systems and processes in many organisation increase fear and anxiety. These include:
Blaming and punishing individuals for deficiencies in the system
Leaving people out of decision-making
Criticising people in front of others
Failing to give people access to the information or resources needed to do a job well
Ignoring suggestions or treating them as criticism
Offering critical feedback on performance without a simultaneous, genuine offer of support
Requiring people to undertake tasks that are unlikely to be completed successfully.
Fear has a way of creeping into organisations, even those that seek to expunge it. Vigilance and effort are required.
Our challenge
Our challenge is to create schools and classrooms where people feel safe and secure. This is not to suggest creating an environment free from responsibility or accountability, rather an environment of respect, dignity and professionalism.
You can begin by asking your staff (if you are a school leader) or your students (if you are a teacher) what causes them to feel anxious or fearful in your school / class? Then work with them to remove these barriers to joy in work and learning.
Reflection
What systems and processes in your workplace give rise to fear?
How do these get in the way of your ability to do a good job?
What practices do you participate in that could promote fear in others?
During the first half of the last century, Joseph Juran undertook studies at Western Electric to examine production defects and nonconformities. Who was to blame for these defects and nonconformities?
He analysed the causes over a defined period of time. Each of the causes were categorised as “management-controllable” or “worker-controllable”. Worker-controllable defects and nonconformities resulted directly from the actions of the worker. Had the worker been doing his job properly these defects and nonconformities would have been prevented. Anything outside the control of the worker was categorised as management-controllable. This included factors such as inadequate training, poor machine maintenance, sub-standard materials, and equipment deficiencies. In other words, anything that is outside the control of the worker is caused by other factors within the system (or the containing systems), which is the domain of management, not the worker.
Don’t blame people; improve the system
Juran’s research led to the often quoted 85/15 rule:
Wherever there is a problem, 85% of the time it will be the system and not the fault of an individual.
In order to bring about improvement, this finding requires us to turn our attention to the system, rather than focus upon individuals.
In social systems, such as schools and classrooms, behaviour and performance are dominated by the impact of structural factors rather than the actions of individuals working within the system.
Peter Senge observed that:
When placed in the same system, people, however different, tend to produce similar results.
Peter Senge, 1990, The Fifth Discipline: The art and practice of the learning organization, Crown, New York, p. 42.
Working on the system
In most schools, the distribution of student performance from one year to the next remains fairly constant. Students in any chosen year level tend to perform similarly to the students that went before them. Teachers’ mark books from year to year look remarkably similar, only the names are different. This is an excellent example of the system producing the results, not the people.
In order to improve performance, we must understand the nature of the systems in which we operate and focus our efforts on working on the system to improve it.
Exhortations, rewards, blame and punishments do nothing to improve the system.They upset people, interfere with relationships and make things worse.
A colleague of ours, Lynne Macdonald, observed:
In schools, parents blame teachers for their children not learning; teachers blame parents; students blame teachers; teachers blame students; principals blame teachers. Where does it get us? Nowhere. So we have to eliminate this blame game.
Lynne Macdonald, retired principal, Plenty Parklands Primary School, Victoria, QLA Case Study 3 DVD.
Most organisations’ problems derive from the system, not the people. Our best efforts cannot compensate for a dysfunctional system.
The work of every organisation is accomplished through processes.
Processes Defined
Process: a sequence of actions that are enacted to achieve a purpose.
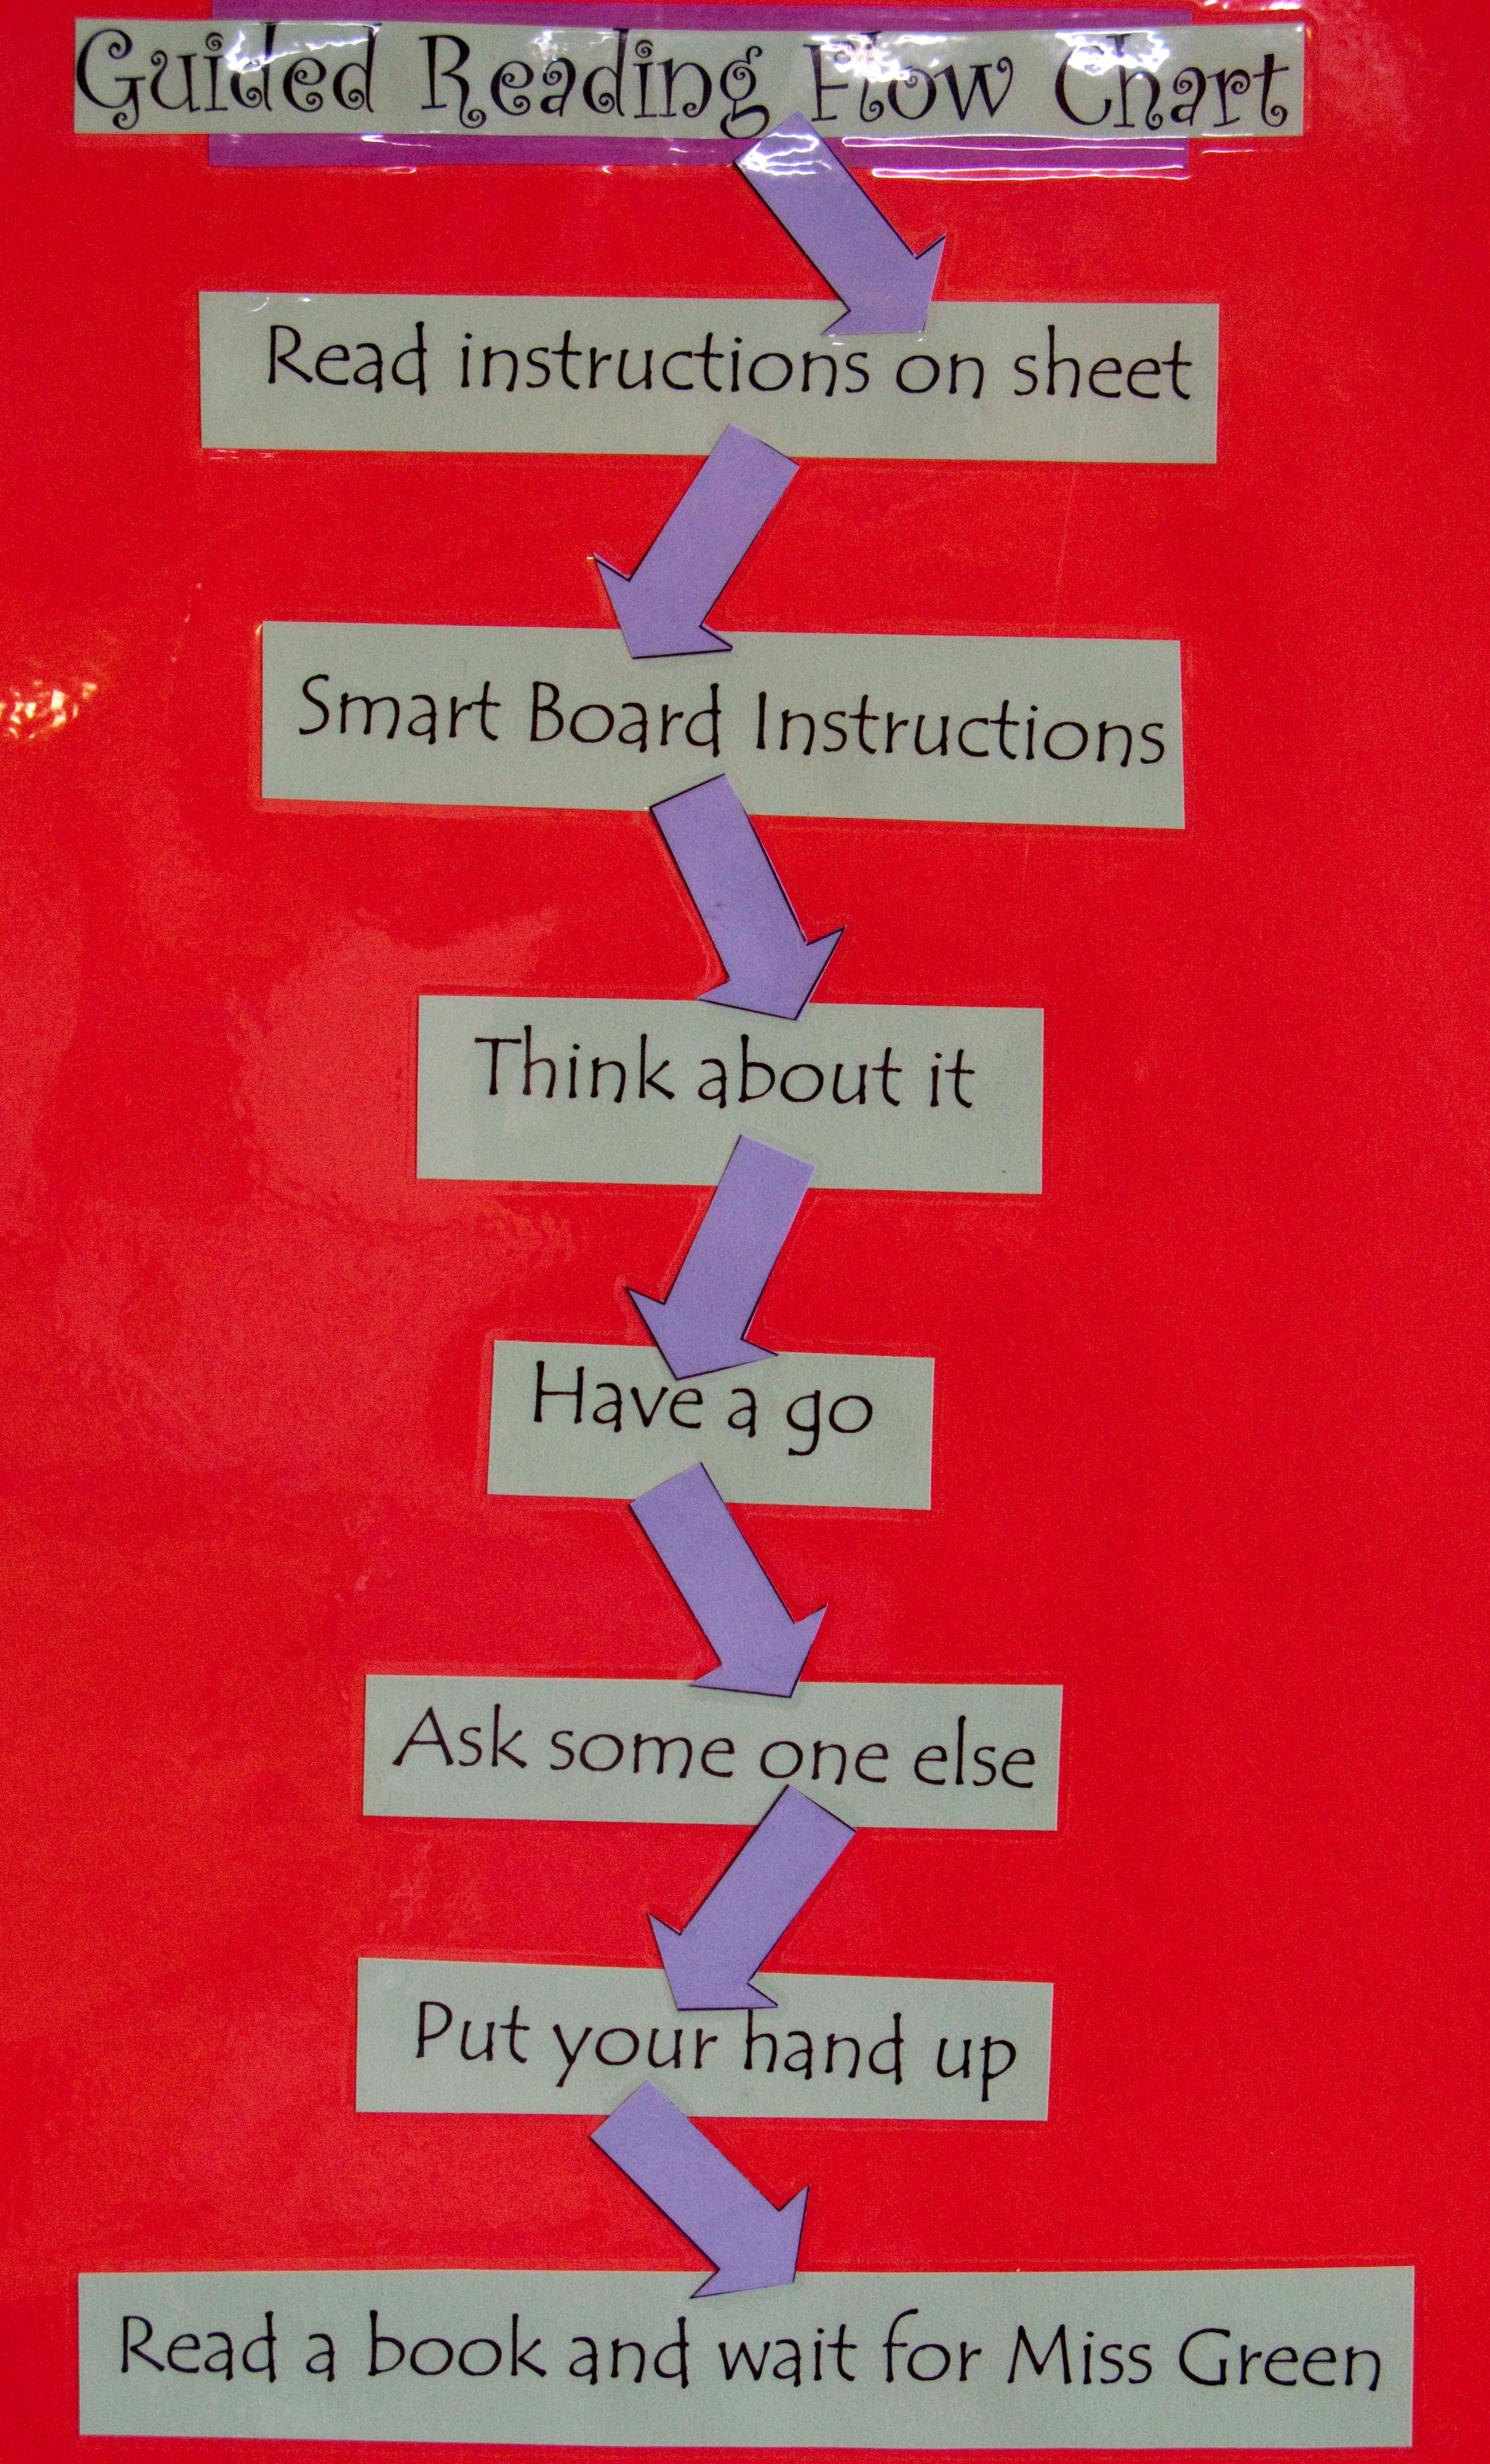
A process consists of actions that are completed in sequence. The sequence of actions comprising a process can be documented, as illustrated in Figure 1.
Figure 1. A Guided Reading Flowchart, from Theodore Primary School
The actions are activities or tasks: things that are done by people, computers and machines.
Getting up in the morning and going to school is a process. It includes actions such as waking up, having breakfast, taking a shower, getting dressed, packing a school bag, and walking to school. These actions are completed in sequence.
A process is, then, a way of doing something: a method.
Key Characteristics of Processes
Purposeful
Processes are means by which the work of an organisation is accomplished. Nothing is achieved without taking action. A sequence of actions is enacted in order to meet some purpose.
Consciously designed… or not
Processes may by consciously designed, defined and documented, or they may be informal and made as needed. Either way, a sequence of actions comprises the process.
Regularly repeated… or not
Most processes in everyday life tend to be repeated on a regular basis.
Processes are usually repeated, in sequence, time after time.
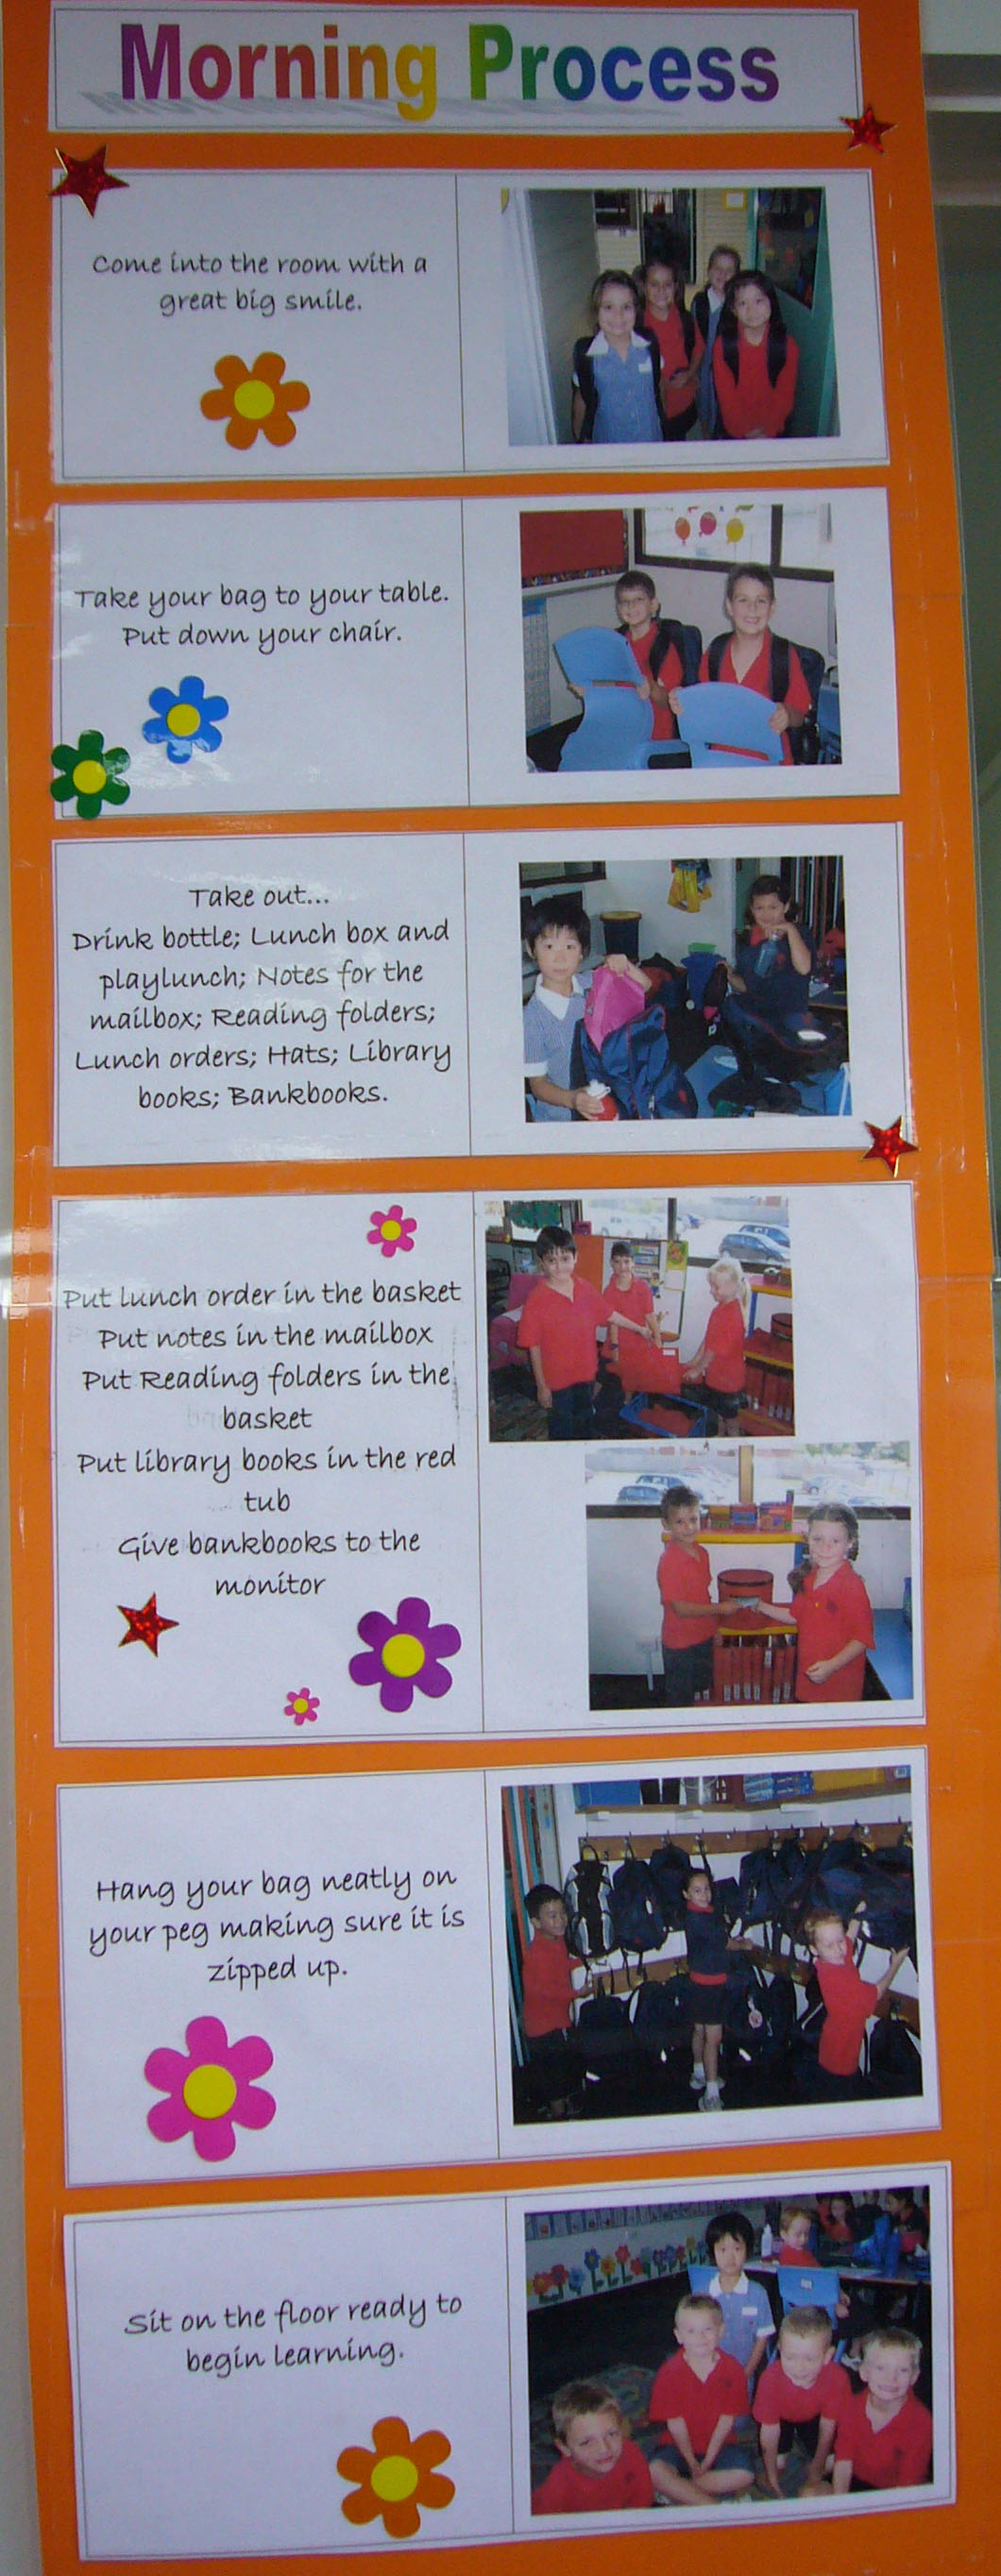
Schools routinely report to parents in a formal manner twice per year, for example. Home learning (homework) process cycles around most days after school. The morning process, such as illustrated in Figure 2, occurs every school day.
Figure 2. A classroom morning process, from Plenty Parklands Primary School.
A few processes may occur only once. A special centenary celebration of a school’s birthday will come around only once. Even so, the preparation, implementation and evaluation of the celebration still comprise a process: it has a sequence of actions that are enacted for a purpose.
Processes are central to improvement
Processes create outputs and deliver outcomes.
If we wish to improve an outcome, we must turn our attention to improving the processes that produced the outcome.
It is important to work on the process that produced the fault, not on him that delivered it.
Edwards Deming, 1994, The New Economics: For industry, government and education, MIT, Massachusetts, p. 39.
This leads to a change of questioning when things don’t go as desired. Instead of asking “whose fault is this?” we can ask “how did our systems and processes allow this to happen?”
If things aren’t going well, fix the process not the blame.
Watch a year two student from Sherbourne Primary School describes the Deployment Flowchart for the spelling process.
There are many types of systems. Social, mechanical, biological, and ecological systems are examples. This post explores the key features of social systems and their implications for leaders of organisations of all types.
Systems
Let’s start with a definition.
A system is a network of interdependent components that work together to try to accomplish the aim of the system.
Edwards Deming, 1994, The New Economics: For industry, government and education, MIT, Massachusetts, p. 5
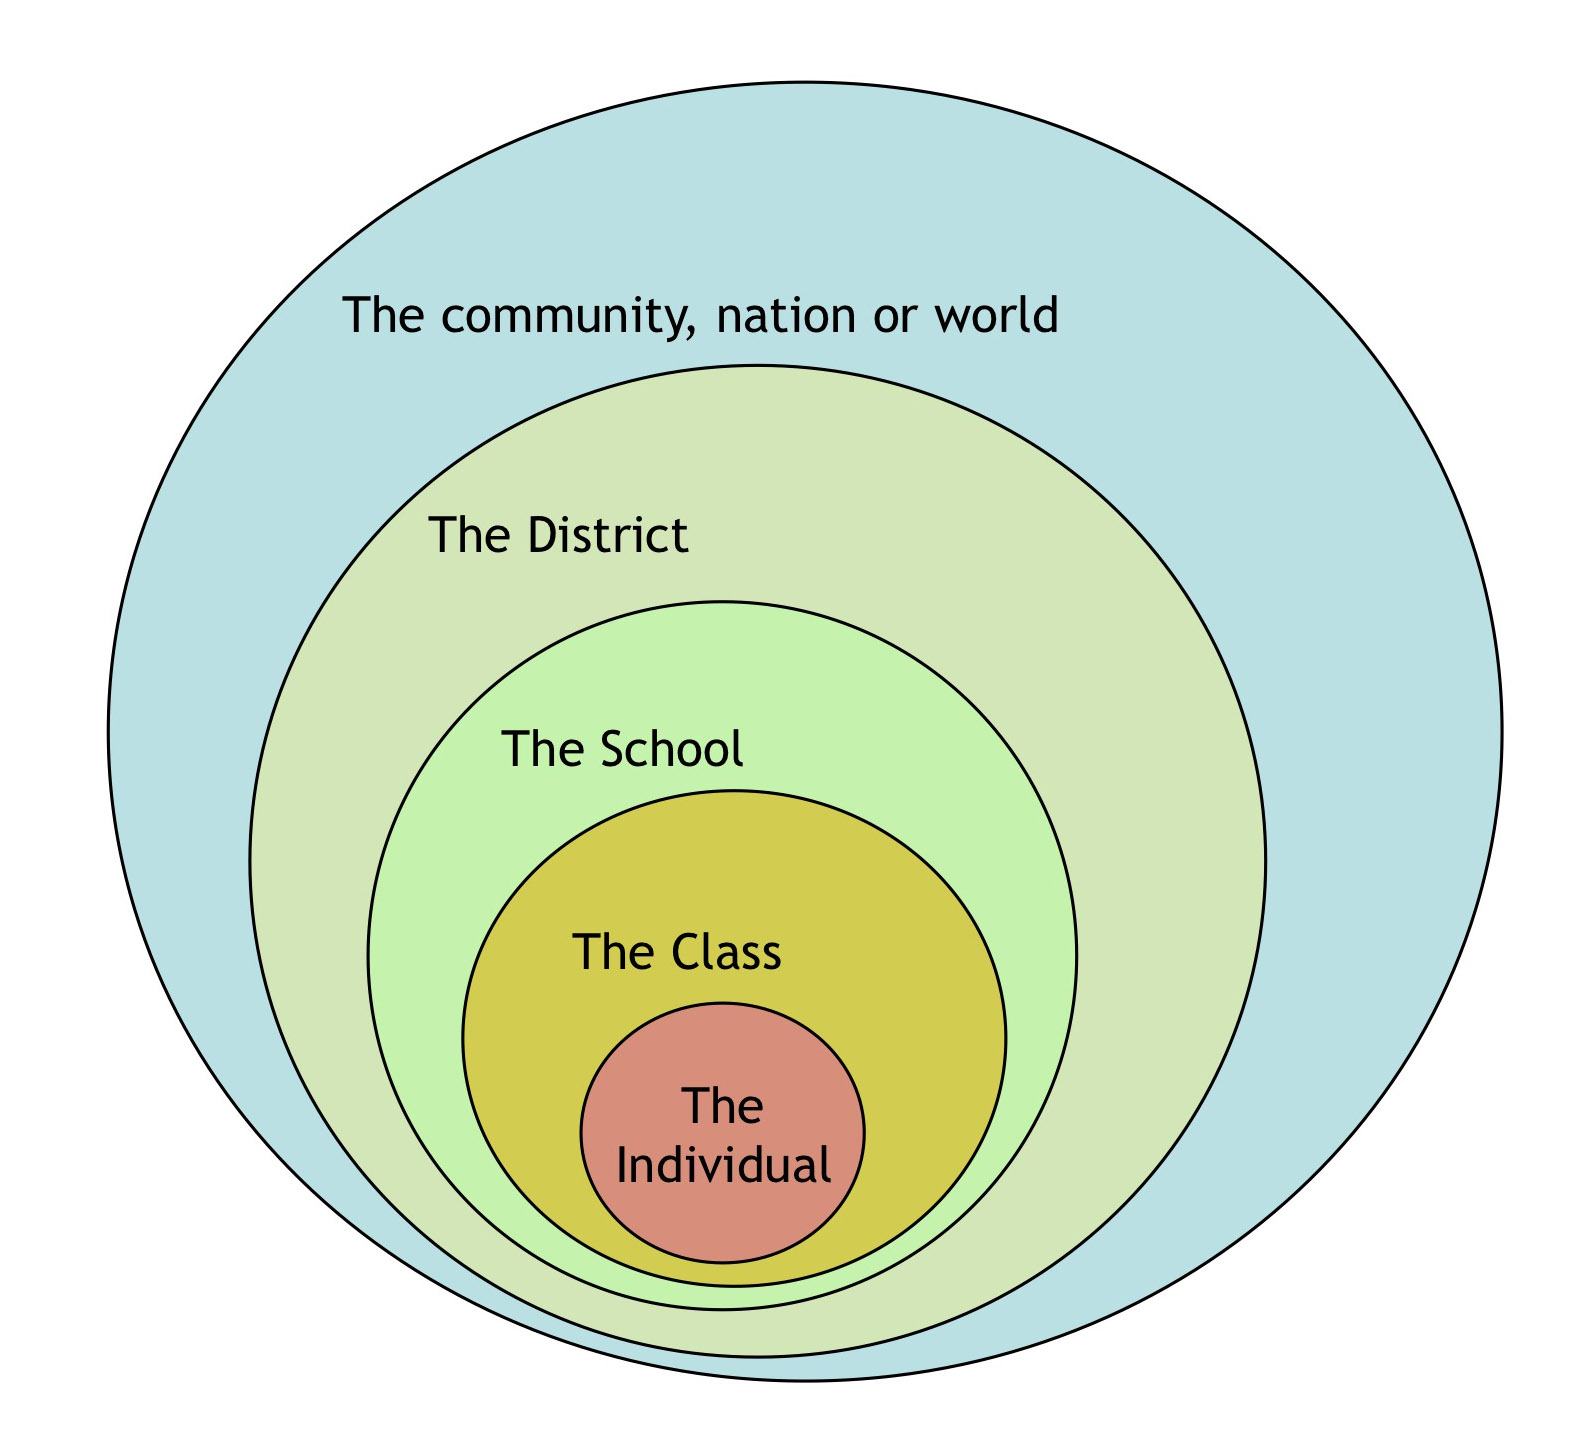
A key feature of systems is interdependence among the elements comprising the system. Another key feature is that systems can nest and be contained within other systems.
To illustrate, the human body is a system of interdependent components. Within the containing system of the human body there are systems such as the nervous, respiratory and circulatory systems. These systems are clearly interdependent.
Figure 1. Systems nest, and are contained, within other systems
Social Systems
Social systems are a specific type of system that exhibit four unique characteristics:
A social system can choose its purpose.
A social system can choose the methods by which it will seek to achieve its purpose.
Elements within a social system can also choose their purpose.
Elements within a social system can choose the methods by which they seek to achieve their purpose.
These characteristics explain why organisations are such dynamic and complex systems to manage and lead.
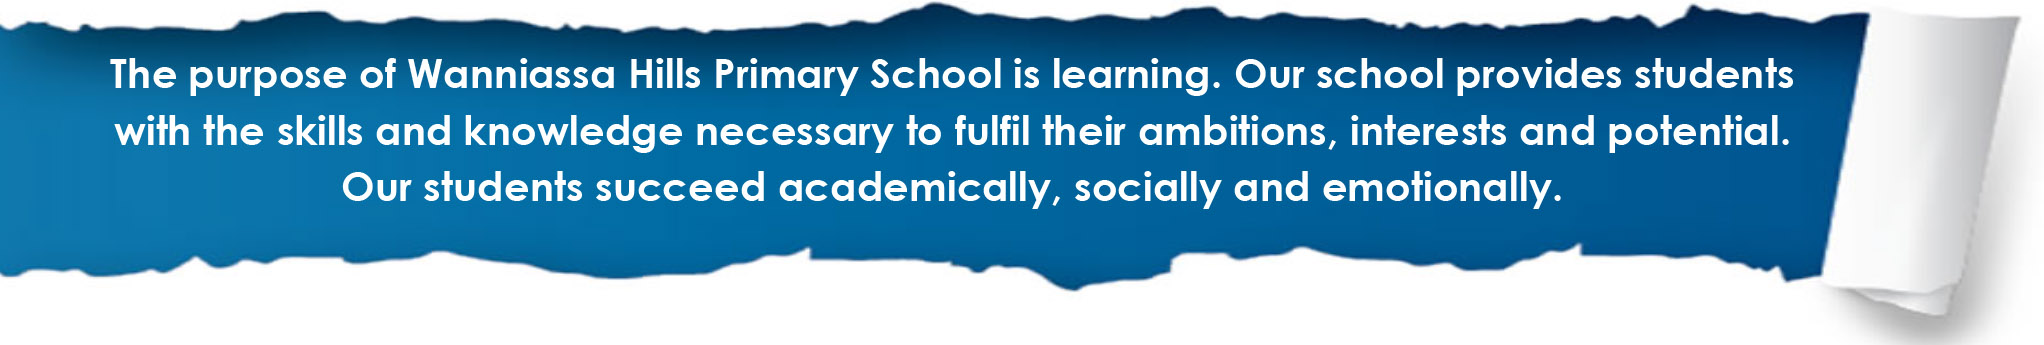
Consider a school, for example. A school is a social system. Within the context of the local education system and its community, a school chooses both its purpose and how it proposes to achieve its purpose. Figure 2 shows the purpose statement for Wanniassa Hills Primary School in the ACT. The school consulted extensively with parents, students and staff over the past few months to discover and document this purpose statement.
Figure 2. Wanniassa Hills Primary School Purpose Statement
Within a school, the various faculties and teams also choose their purposes and methods to achieve them. For the school to optimise its efforts, the aims and methods of the individuals and teams need to align to those of the school as a whole.
Many teachers and school leaders can share stories of individuals and groups within a school not being aligned with the aspirations of the school community as a whole. It can be very frustrating for everyone.
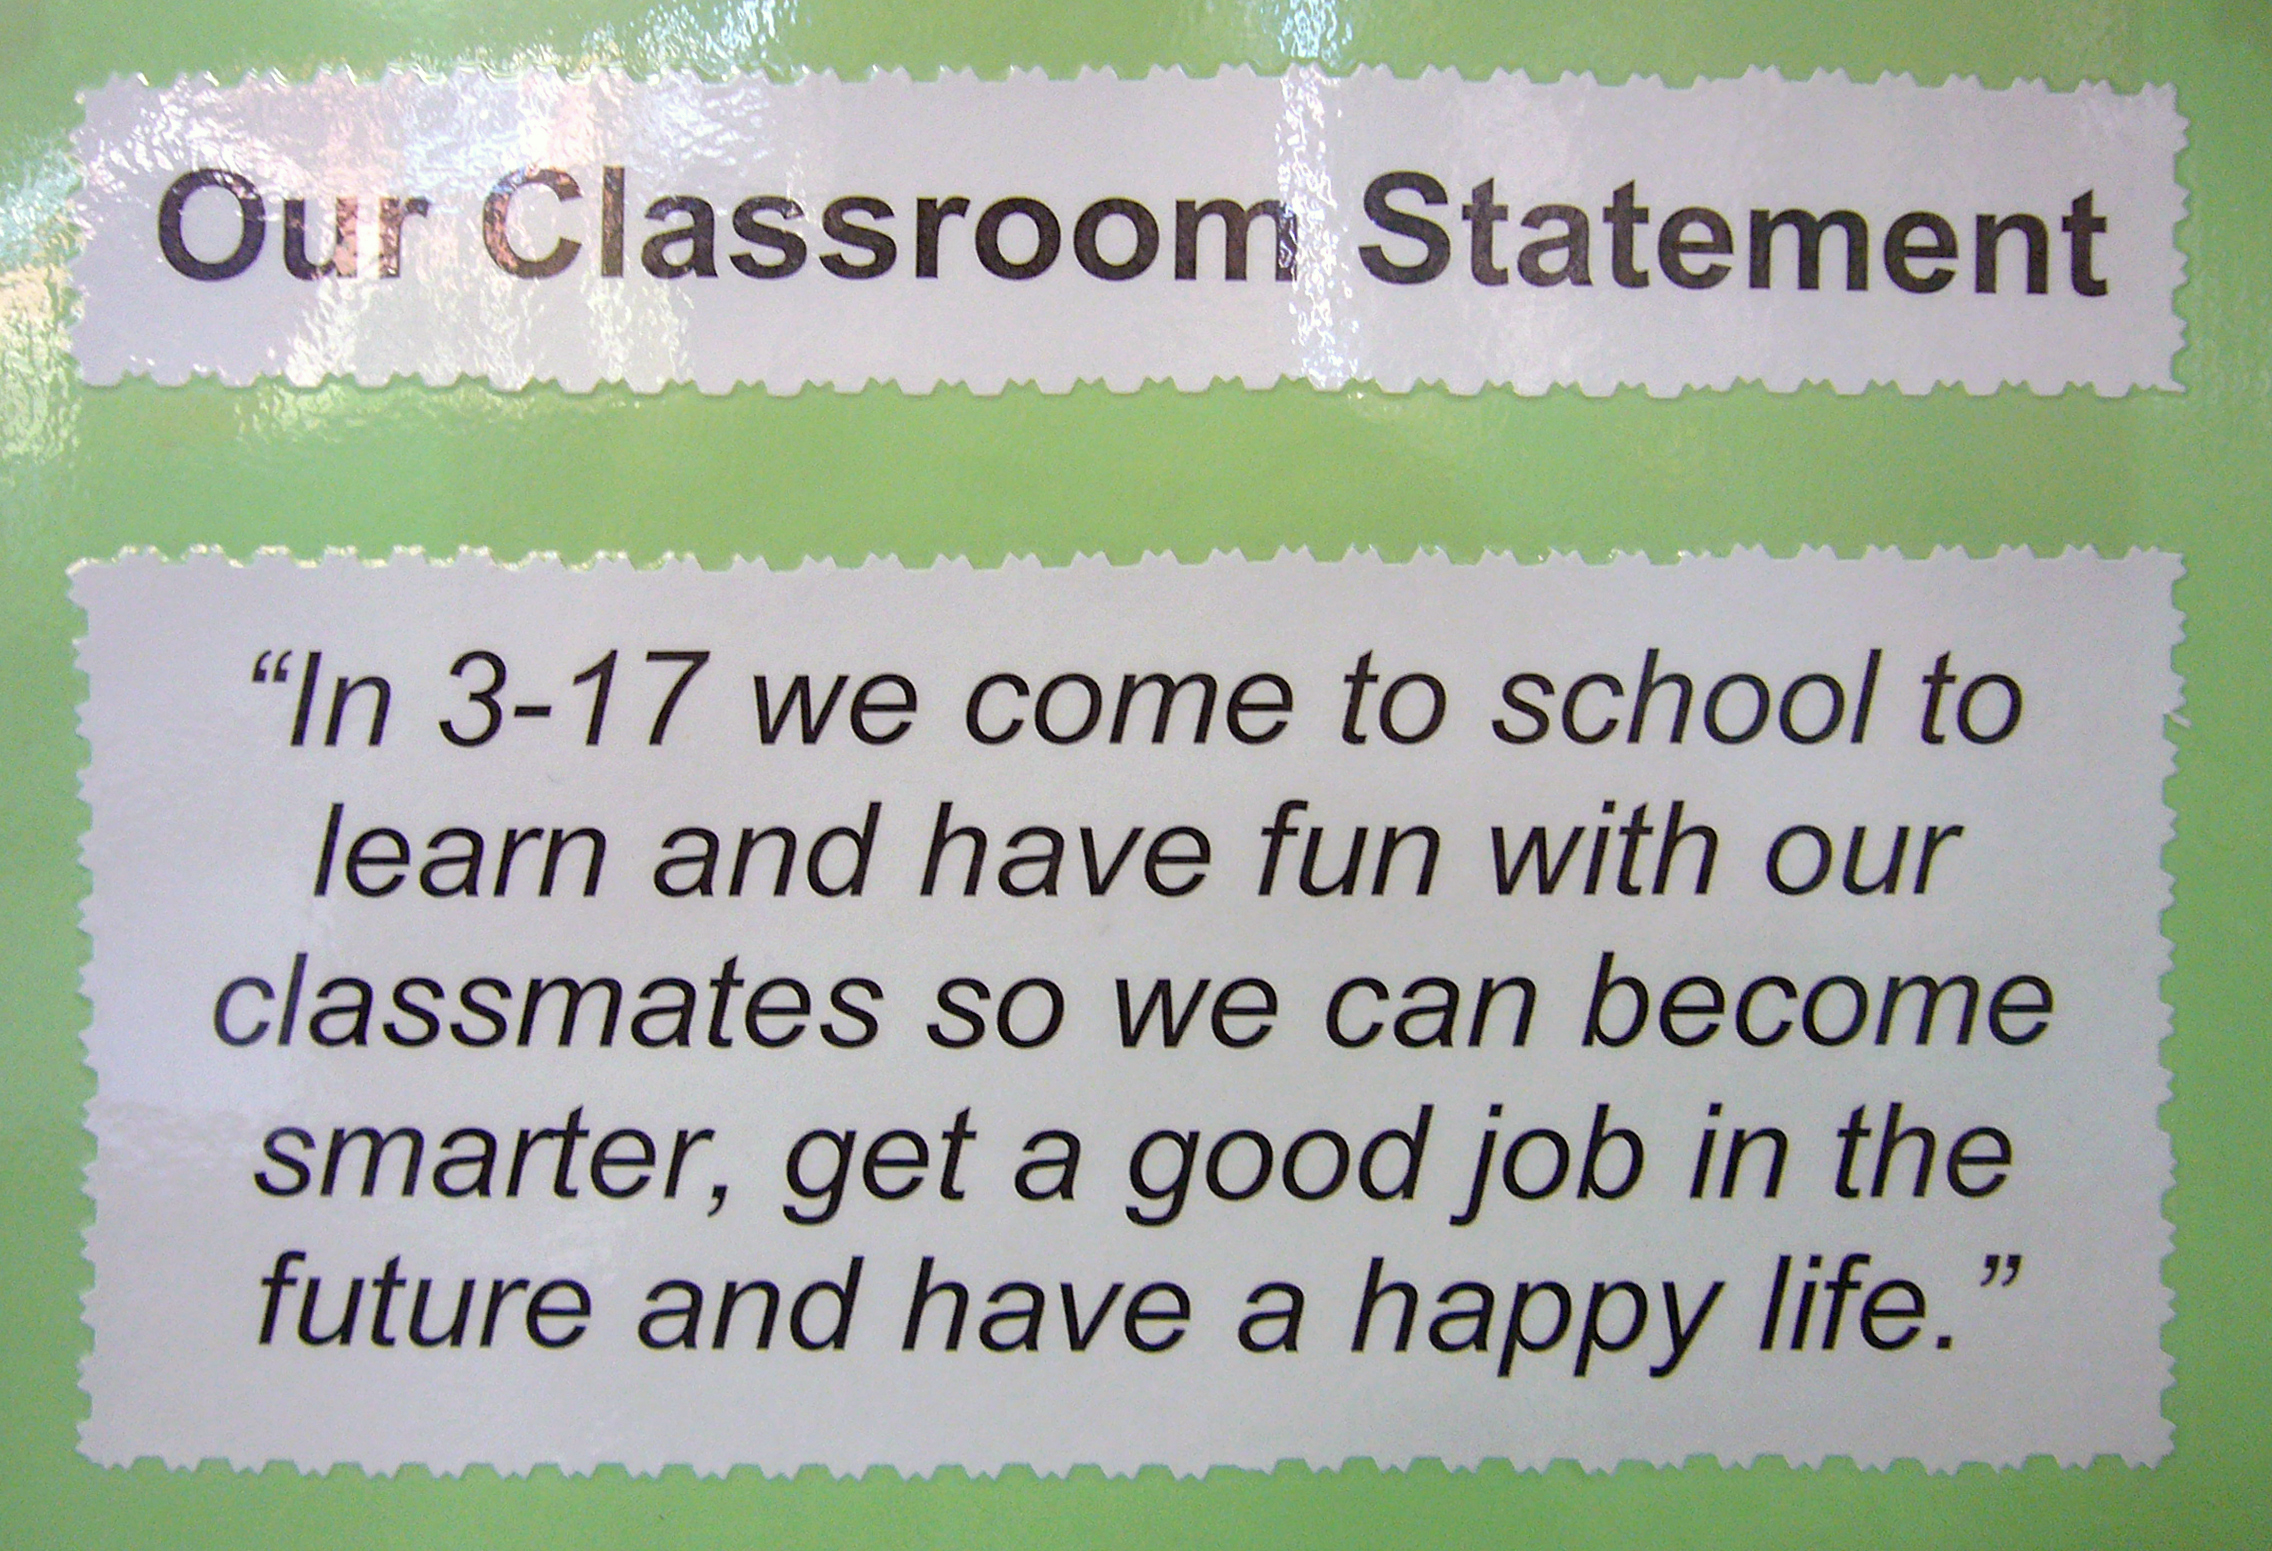
Similarly a class is a social system. The class can choose its purpose, like that shown in Figure 3. The class can also choose how it will seek to fulfil its purpose. Within a class, individual students and groups of students choose their purpose and how they wish to go about it. This is evident from moment to moment as students may choose to ‘tune in’ or engage in disruptive behaviour.
Figure 3. A class clarifies its purpose with a mission statement
In summary:
The system as a whole chooses purpose and methods, as do elements within the system.To optimise the efforts of a school, the purpose and methods of the individuals and groups within the school need to align to that of the school as a whole. The same applies to classrooms.
Interaction effects
A key reason organisations are such dynamic and complex entities is the impact of interactions among the elements. The interactions among members of a class and the interactions among teachers and groups of teachers are two examples of these interaction effects.
As the number of people in an organisation increases, the number of potential interactions increases exponentially. In fact, the impact of interaction effects becomes way more dominant than the impact of individuals within the organisation.
The interactions among individuals and groups can be positive and add to the performance of the whole. They can also be negative and detract from performance.
Interactions can lead to harmony, and they can lead to discord.
This is self evident to most teachers and school leaders who have worked in a variety of schools, from those with a tired and cynical culture to the vibrant and collaborative team.
Interaction may reinforce efforts, or it may nullify efforts.
Edwards Deming, 2012, The Essential Deming: Leadership Principles from the Father of Quality, edited by Joyce Orsini, McGraw-Hill, New York, p. 78.
Interactions dominate the behaviour and performance of social systems. Consequently, the behaviour and performance of a classroom, workgroup or organisation is much more heavily influenced by the interaction among people than by the direct impact of each individual. This is why creating a school climate that promotes caring and productive relationships is so important.
Conclusion
Schools are complex, dynamic and highly relational social systems. The interdependence among the individuals and groups within schools and the interactions among them, are key determinants of the culture, behaviour and performance of the school. The same applies to classrooms.
It is incumbent on leaders, therefore, to ensure that system and processes promote positive interactions with purposeful and harmonious relationships.
Sometimes it’s desirable to gather views on more than one issue, and to examine the relationship between responses to these issues.
A Correlation Chart is useful for examining the relationship between responses.
Correlation Chart
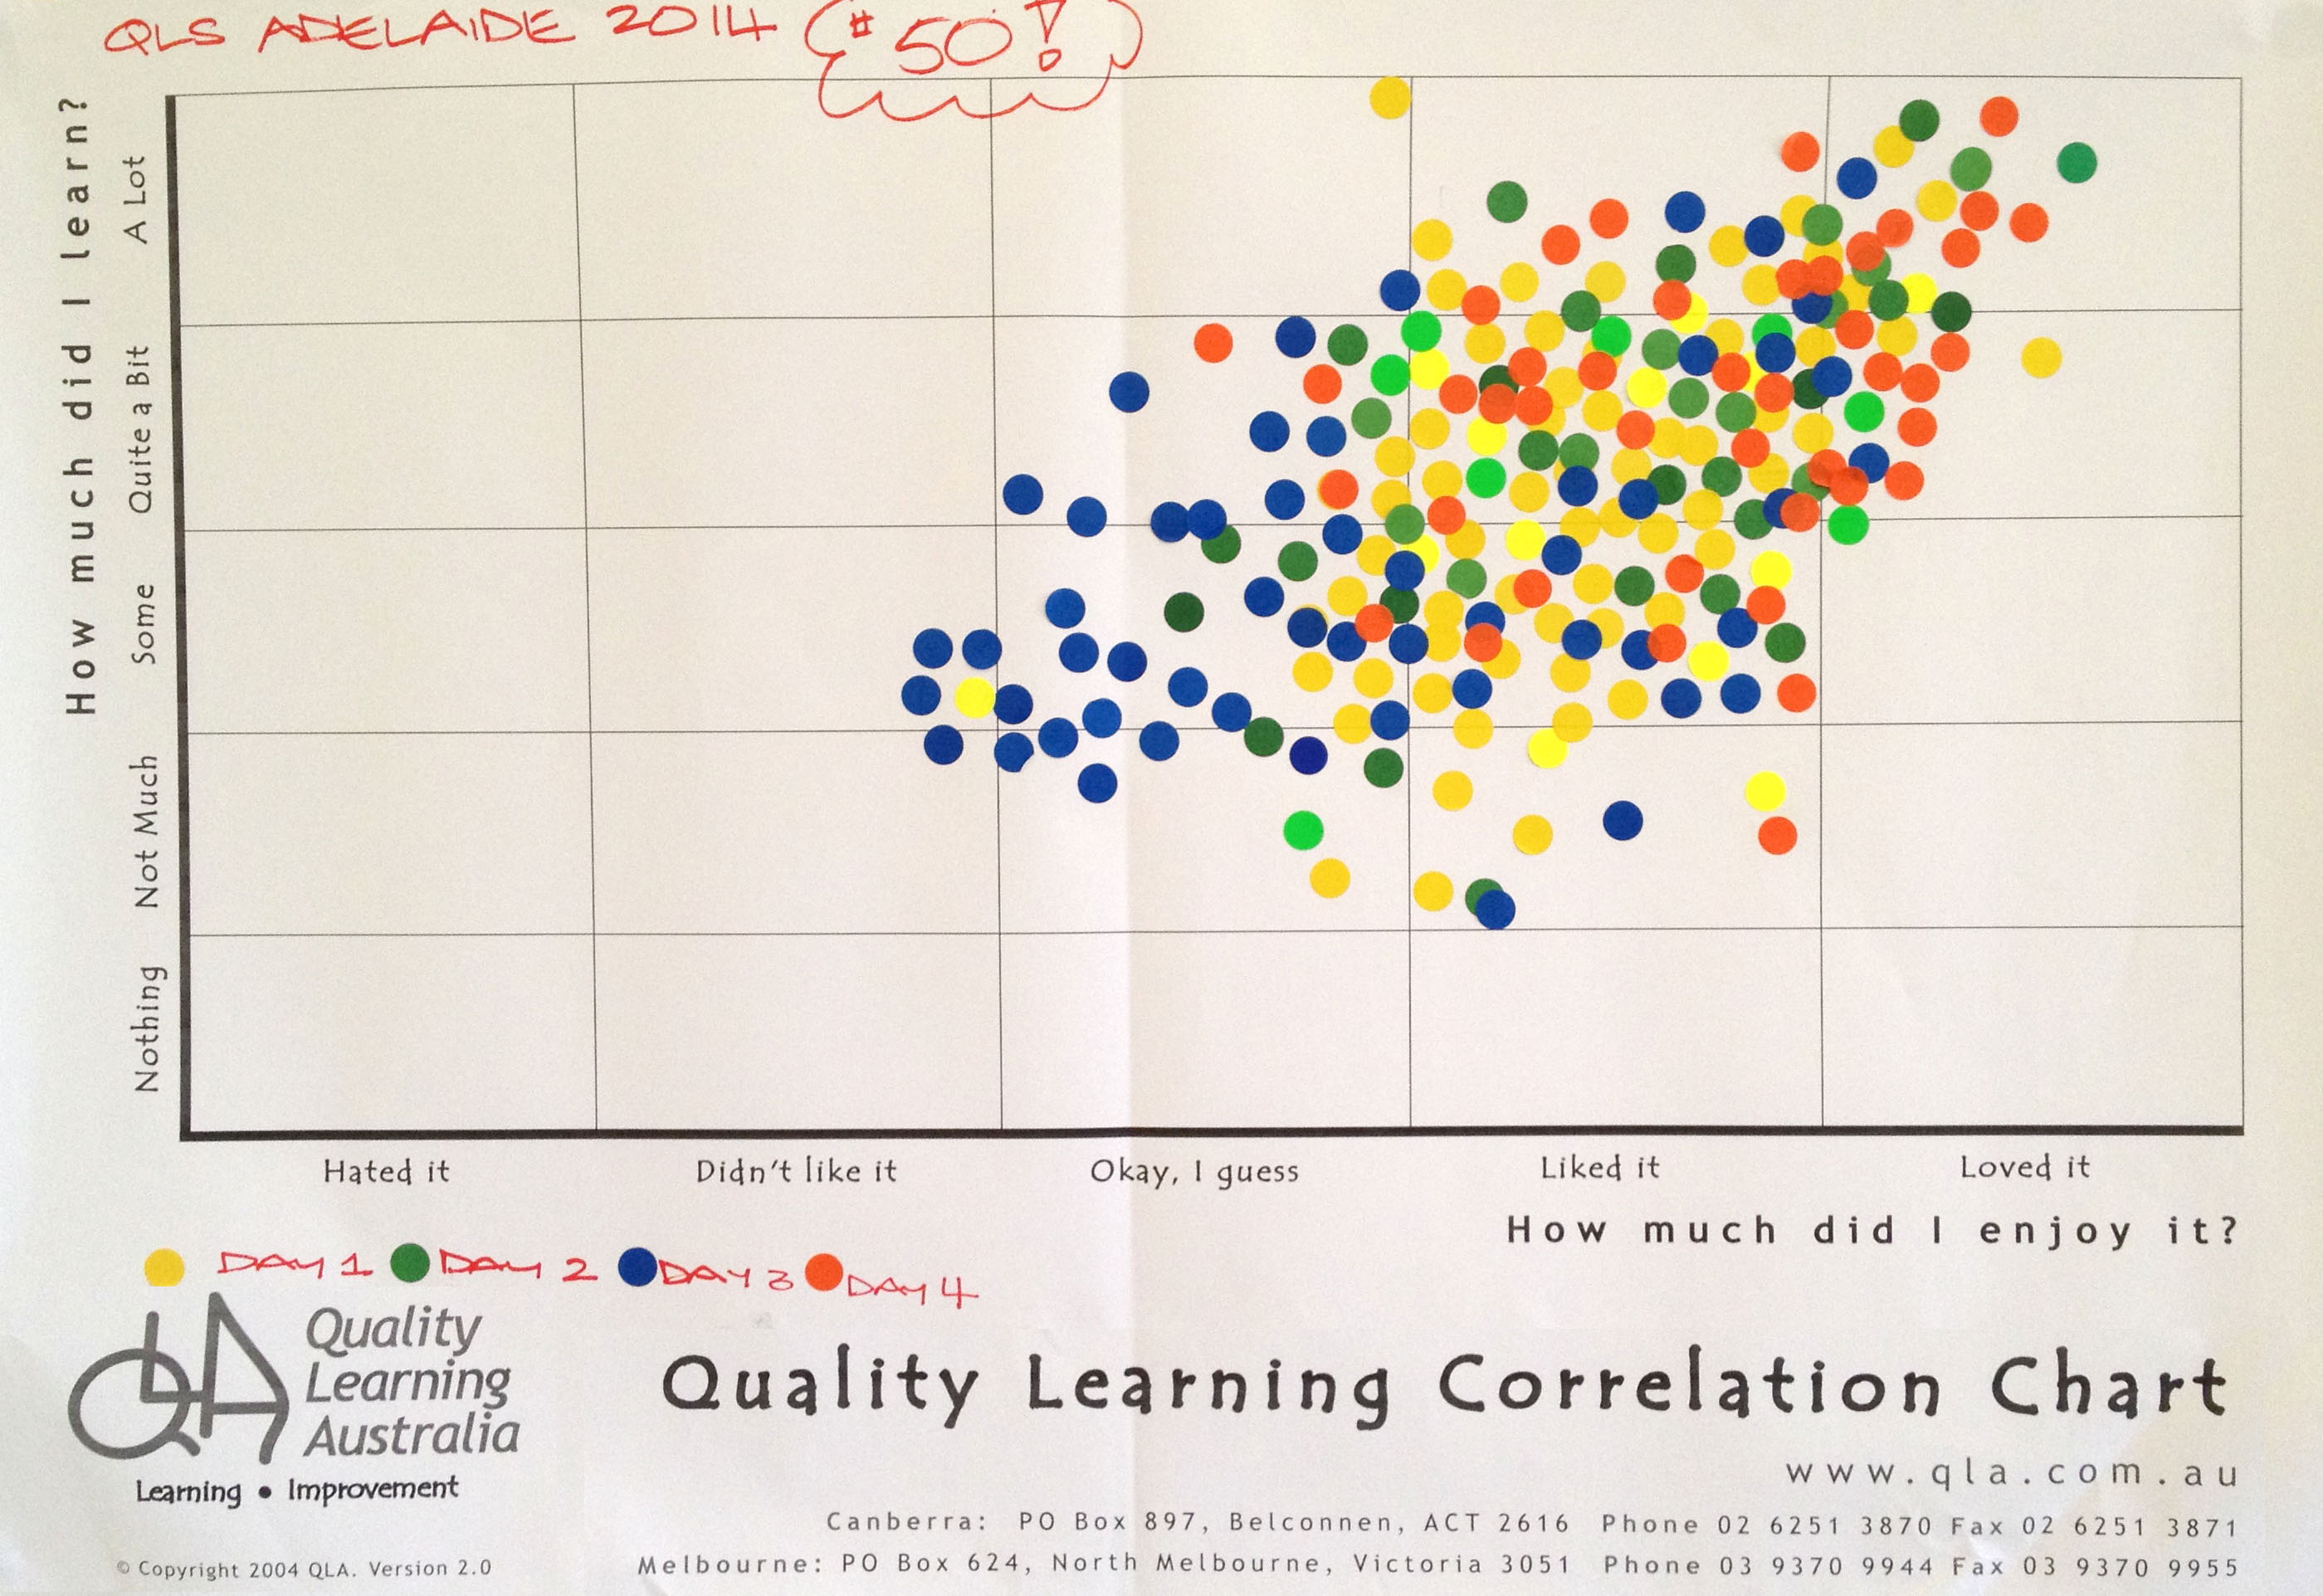
We regularly use a Correlation Chart as a quick and effective way to gather feedback from participants in our workshops. Figure 1 shows a Correlation Chart from a workshop – the 50th four-day Quality Learning Seminar with David Langford held in Australia.
Figure 1. Workshop participant feedback on a Correlation Chart
Many teachers use a Correlation Chart at the end of a unit of work to gather student feedback on the unit.
Set the questions and scale
The first step when using a Correlation Chart is to decide the questions. The most common question are those shown in Figure 1, namely:
How much did you enjoy the workshop/course/unit of work?
How much did you learn?
The questions must lend themselves to a scaled response.
Binary questions, which have only two responses such as yes or no, don’t work for a Correlation Chart.
Scales we have seen used effectively include:
Frequency: rarely to nearly always
Importance: not important to critical
Performance: very poor to excellent
Amount: nothing to a lot
Disposition: hate it to love it
Knowledge: never heard of it to mastered it
Confidence: not confident to supremely confident.
Whichever scale you choose, respondents will find it helpful if you define ‘anchor points’ along the scale. We typically define five such points. For example, for Frequency:
Rarely (10%)
Sometimes (25%)
Moderately (50%)
Mostly (75%)
Nearly Always (90%)
Gather and display the data
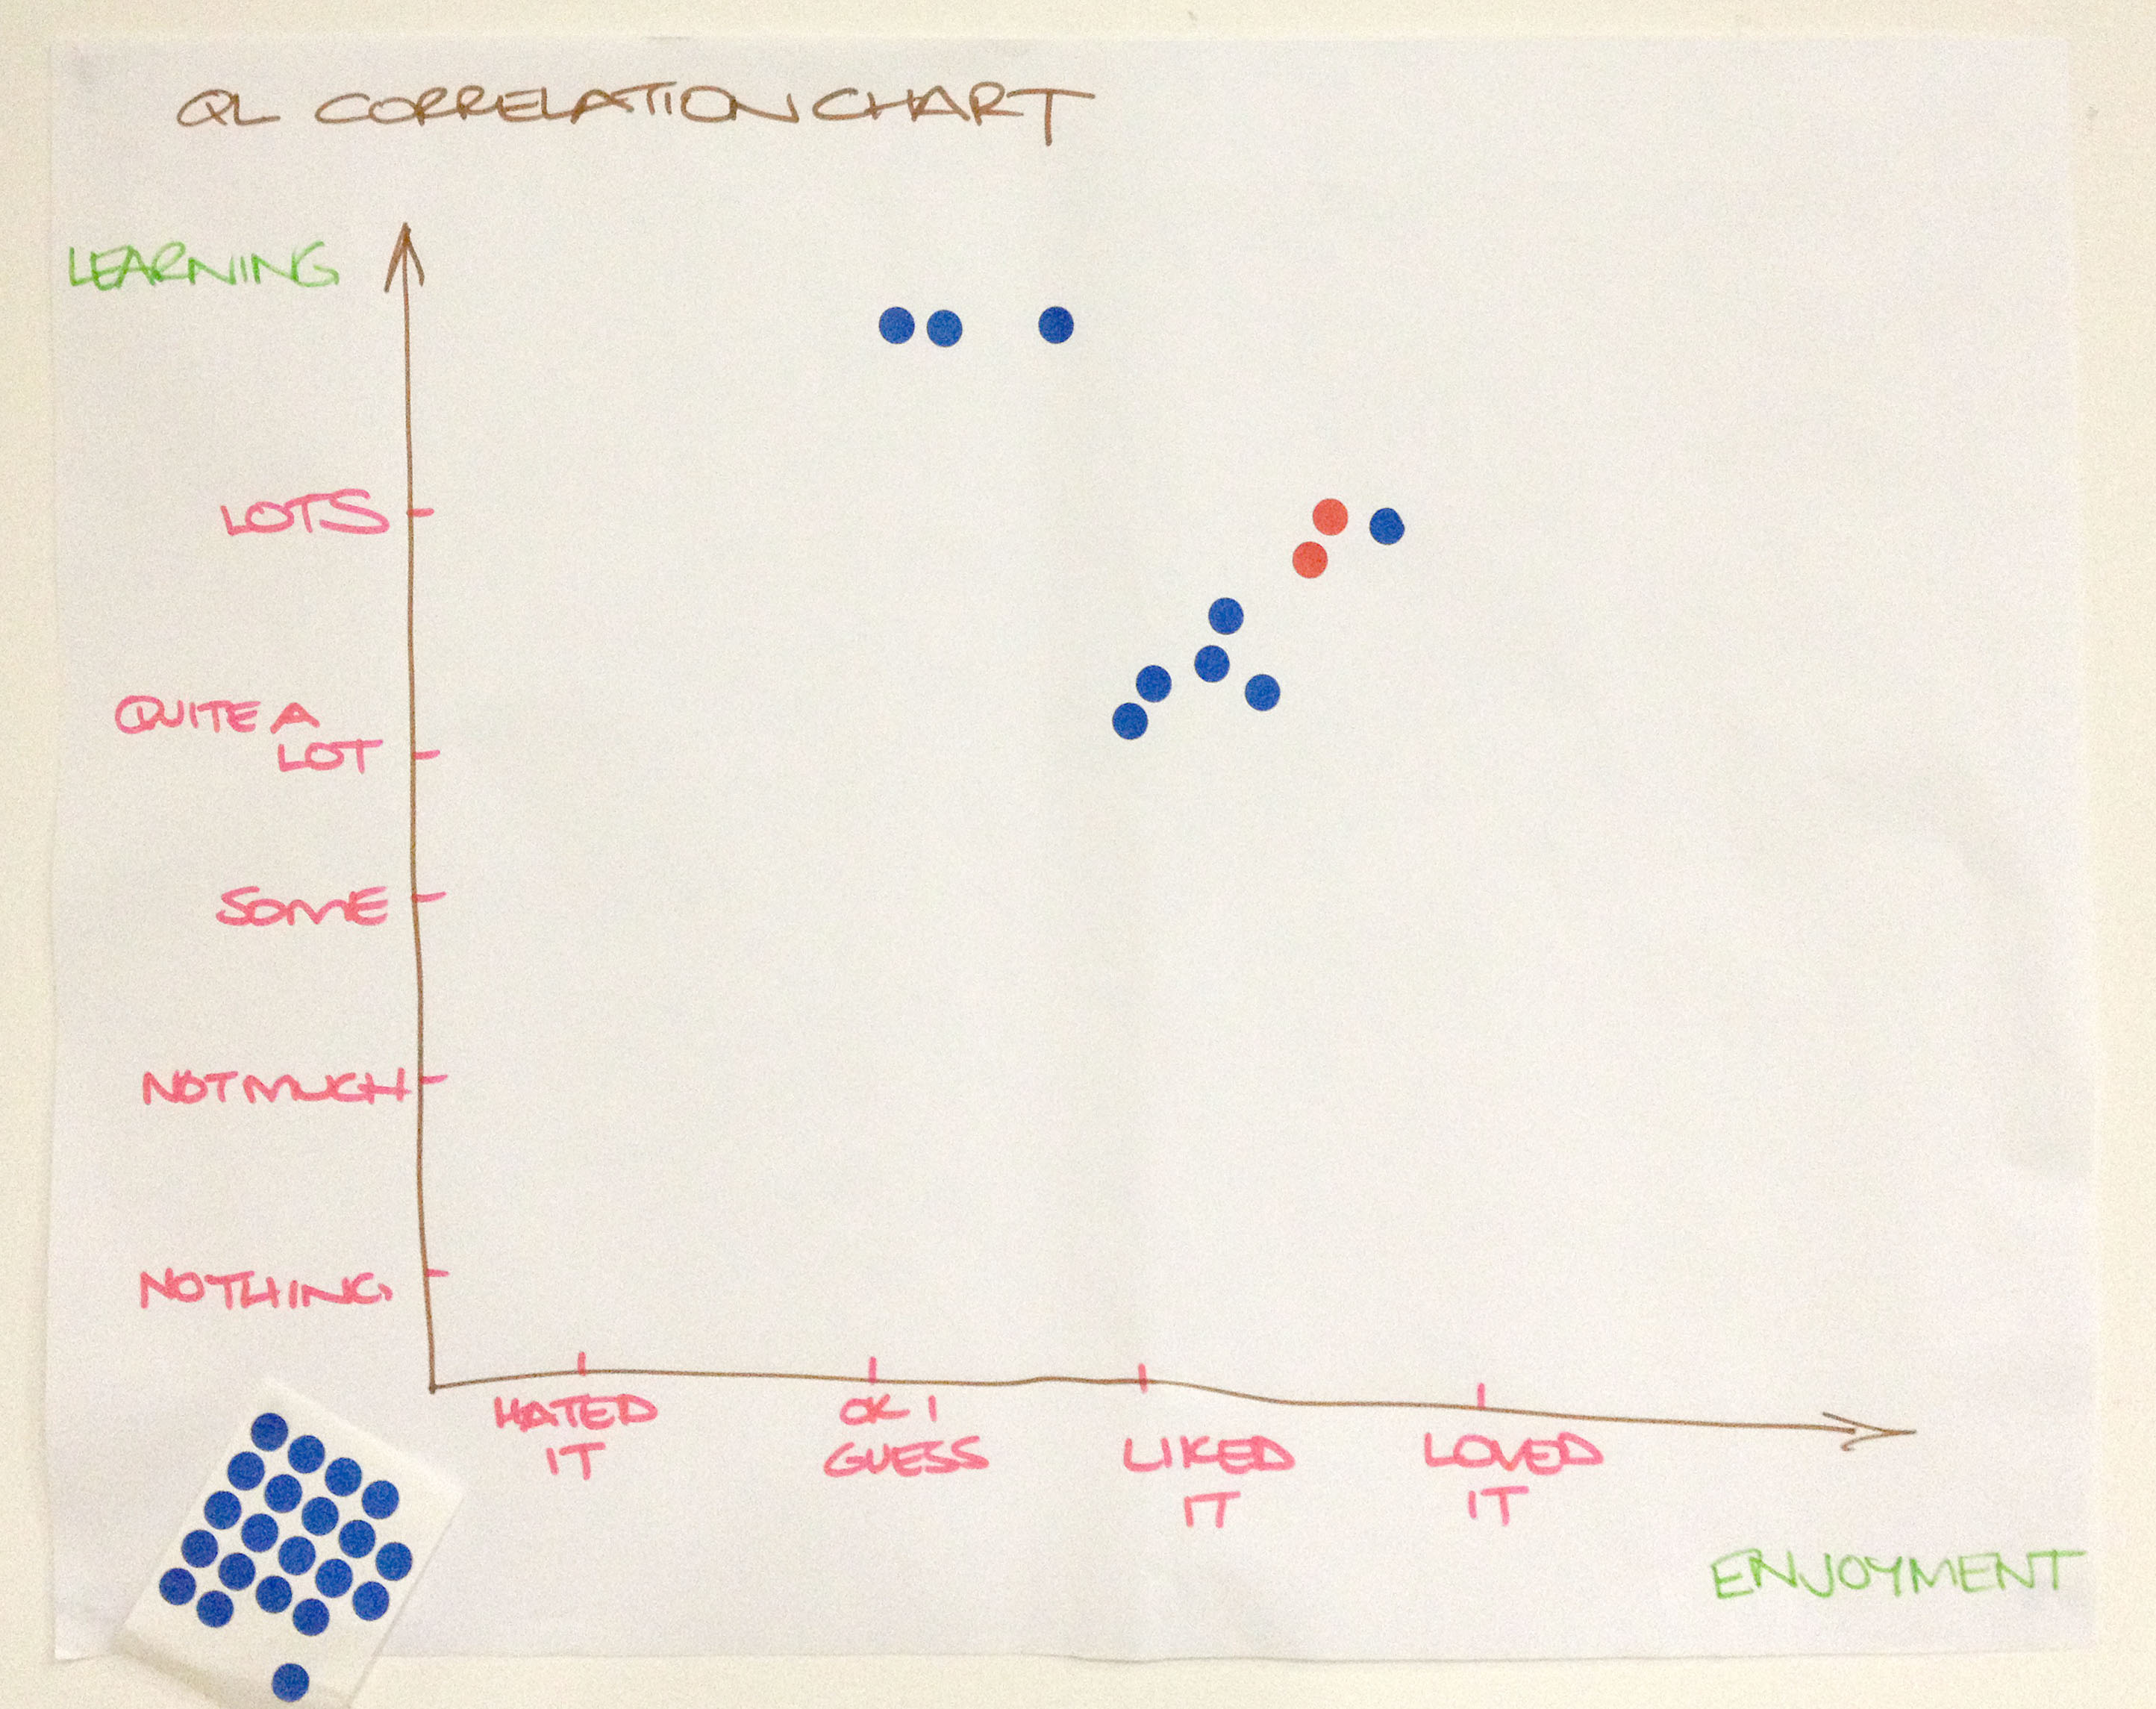
Having determined the questions and scale, the next step is to draw up the correlation chart. It doesn’t have to be typed and printed; hand written charts, such as that shown in Figure 2 work quite well.
Figure 2. A hand-written Correlation Chart
Provide a sheet of adhesive dots (or a marker pen). Invite respondents to place a dot in the chart in response to the two questions.
Consider the relationship
What patterns can you see in the data? In Figure 1, you will notice the tendency for individuals’ ratings of learning and enjoyment to be quite similar. Those who reported they enjoyed the seminar more tended to report learning more. In other words, there is a positive correlation between these variables.
Remember, correlation does not mean causation. Correlation only indicates a relationship exists, it doesn’t explain the nature of the relationship. In Australia, for instance, there is a correlation between sales of ice cream cones and shark attacks; nobody suggests one causes the other.
Decide what to do next
Data inform decisions. We collect data to help us decide what to do next. Be sure to consider what the data are suggesting you need to do.
Benefits of a Correlation Chart
A Correlation Chart is easy to use. It can easily be made during a staff or class meeting, with the results instantly visible for everyone to see. It is much easier than a survey!
Everyone can see their own dots on a Correlation Chart; they know their voice is heard and that their opinion matters.
Like many of the Quality Learning tools, a Correlation Chart gives voice to the silent majority while giving perspective to the vocal minority. People see how their perspective relates to those of others in the group.
Keep in mind
A Correlation Chart does not provide any information regarding the reasons for the responses. Take care not to attribute reasons without further investigation.
Respect the anonymity of the respondents. If there are outlier responses – special causes – that are clearly different to those of the majority, don’t seek to identify the individuals concerned. Rather, invite the individual(s) to have a quiet word with you later so you can understand their perspective. There is frequently richness in the views of outliers.
In 1993, Myron Tribus proclaimed: The job of the manager has changed.
People work in a system. The job of a manager is to work on the system, to improve it, continuously, with their help. Myron Tribus, 1993, “Quality Management in Education”, Journal for Quality and Participation, Jan–Feb, p. 5. Available at http://www.qla.com.au/Papers/5.
What did Tribus mean?
System
Firstly, we need to understand what he meant by system. Dr Deming defined a system to be:
A system is a network of interdependent components that work together to try to accomplish the aim of the system. Edwards Deming, 1994, The New Economics: For industry, government and education, MIT, Massachusetts, p. 50.
Because Tribus is referring to managers, we understand him to be speaking of organisations. Organisations are systems comprising interdependent components working together towards some aim. A school is a system. A classroom is a system. A school district or region is a system.
A way of thinking about systems, in this context, is to think about how all the elements work together, as a whole, to get things done. How do school policies, procedures, facilities, committees, teams, classrooms, parents, leaders, teachers and students, for example, all work together to achieve the purpose and vision for the school?
Manager
Secondly, we need to understand whom Tribus is referring to in saying the job of the manager has changed.
Management is the ability to organise resources and coordinate the execution of tasks necessary to reach a goal in a timely and cost effective manner. Kovacs and King, 2015, Improving Learning: A how-to guide for school improvement, QLA, Canberra, p387
Managers therefore are those seeking to reach goals, by working with tasks, resources, systems and processes. Under this definition, it’s hard to identify individuals who are not managers. Everybody in a school is organising resources and coordinating tasks to achieve goals, even students! For this conversation, however, let us limit our discussion to adults. Principals, teachers and support staff are all working with their colleagues and students to achieve the goals of the school and classroom.
Working in and on
Thirdly, Tribus makes the distinction between working in the system and working on the system.
Working in the system is doing the daily work of the system.
For a teacher, this usually means managing the daily routines of learning and teaching in the classroom: planning, programming, instruction, assessment, reporting and so on. For school leaders this includes: meeting with parents, providing support to school staff, attending meetings, managing the budget, responding to emails and phone calls, and so on. This is all the daily work – working in the system.
Working on the system is improvement work.
Working on the system comprises two types of activities: improvement projects and innovation projects. Both involve making changes to the existing system.
Improvement projects focus on making the existing system more efficient and/or effective.
This is achieved by improving how the elements of the system work together, usually by making changes to the processes and methods by which the work is done. Refining the enrolment or reporting process in a school would be examples of improvement projects. Improvement projects build on existing approaches to make the existing system work better.
Innovation projects are about creation of new systems, processes, products and services by the organisation.
In a school context, innovation projects are about new technologies, new programs and system reforms. Replacing parent-teacher interviews with student-led conferences would be an example of an innovation project. Innovation projects are about new approaches that prepare or position the organisation for the future.
Given this, Tribus is telling us that all mangers within an organisation have an obligation to contribute to improvement efforts. But there is a subtle twist in the last three words of his proclamation: with their help.
…with their help
Finally, Tribus is explicit that managers should not unilaterally impose changes upon those working in the system. All managers need to be involved in projects that work on the system, but these projects need to engage those working within the system. After all, it is those doing the daily work of the system that know most about how it is done and could be improved.
Students know best the barriers to their learning; teachers know best what gets in the way of their teaching.
Within a school context, Tribus is saying that all adults need to be engaged working on the system to bring about improvement. They need to be participating in improvement and innovation projects, as project leaders in their own areas or team members with others’ projects. Students also need play an active role, contributing to improving their school and classroom.
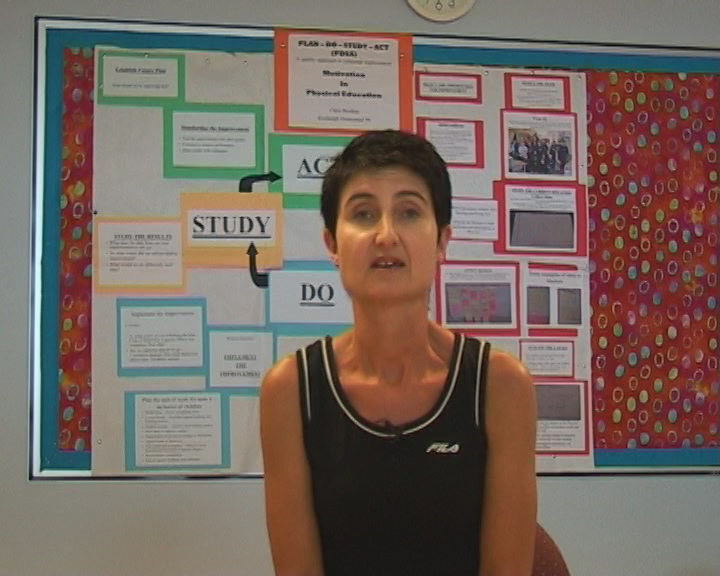
We have previously discussed the power of the Plan-Do-Study-Act (PDSA) cycle in bringing about collaborative, sustainable improvement. We have also emphasised the importance of allowing students to play a key role – giving students a ‘real voice’ – in improving their school and classroom. In this blog, we share another example. This time, how the PDSA process was used by a teacher and students to improve learning and engagement in their physical education (PE) classroom. (You can also view this as a QLA case study video.)
Teacher, Chris, with her PE class PDSA storyboard
Chris is a leading specialist teacher at a Victorian primary school. She observed the school’s Year 6 students becoming increasingly disengaged during their weekly PE lessons. PE teachers were stressed and student behaviour was worsening. No one was enjoying PE!
Chris decided it was time to set students and teachers to work to improve PE by applying the PDSA cycle.
As we have seen previously:
PDSA is a highly effective improvement approach, based upon a cycle of theory, prediction, observation, and reflection.
It involves applying a structured process to achieve sustainable improvement.
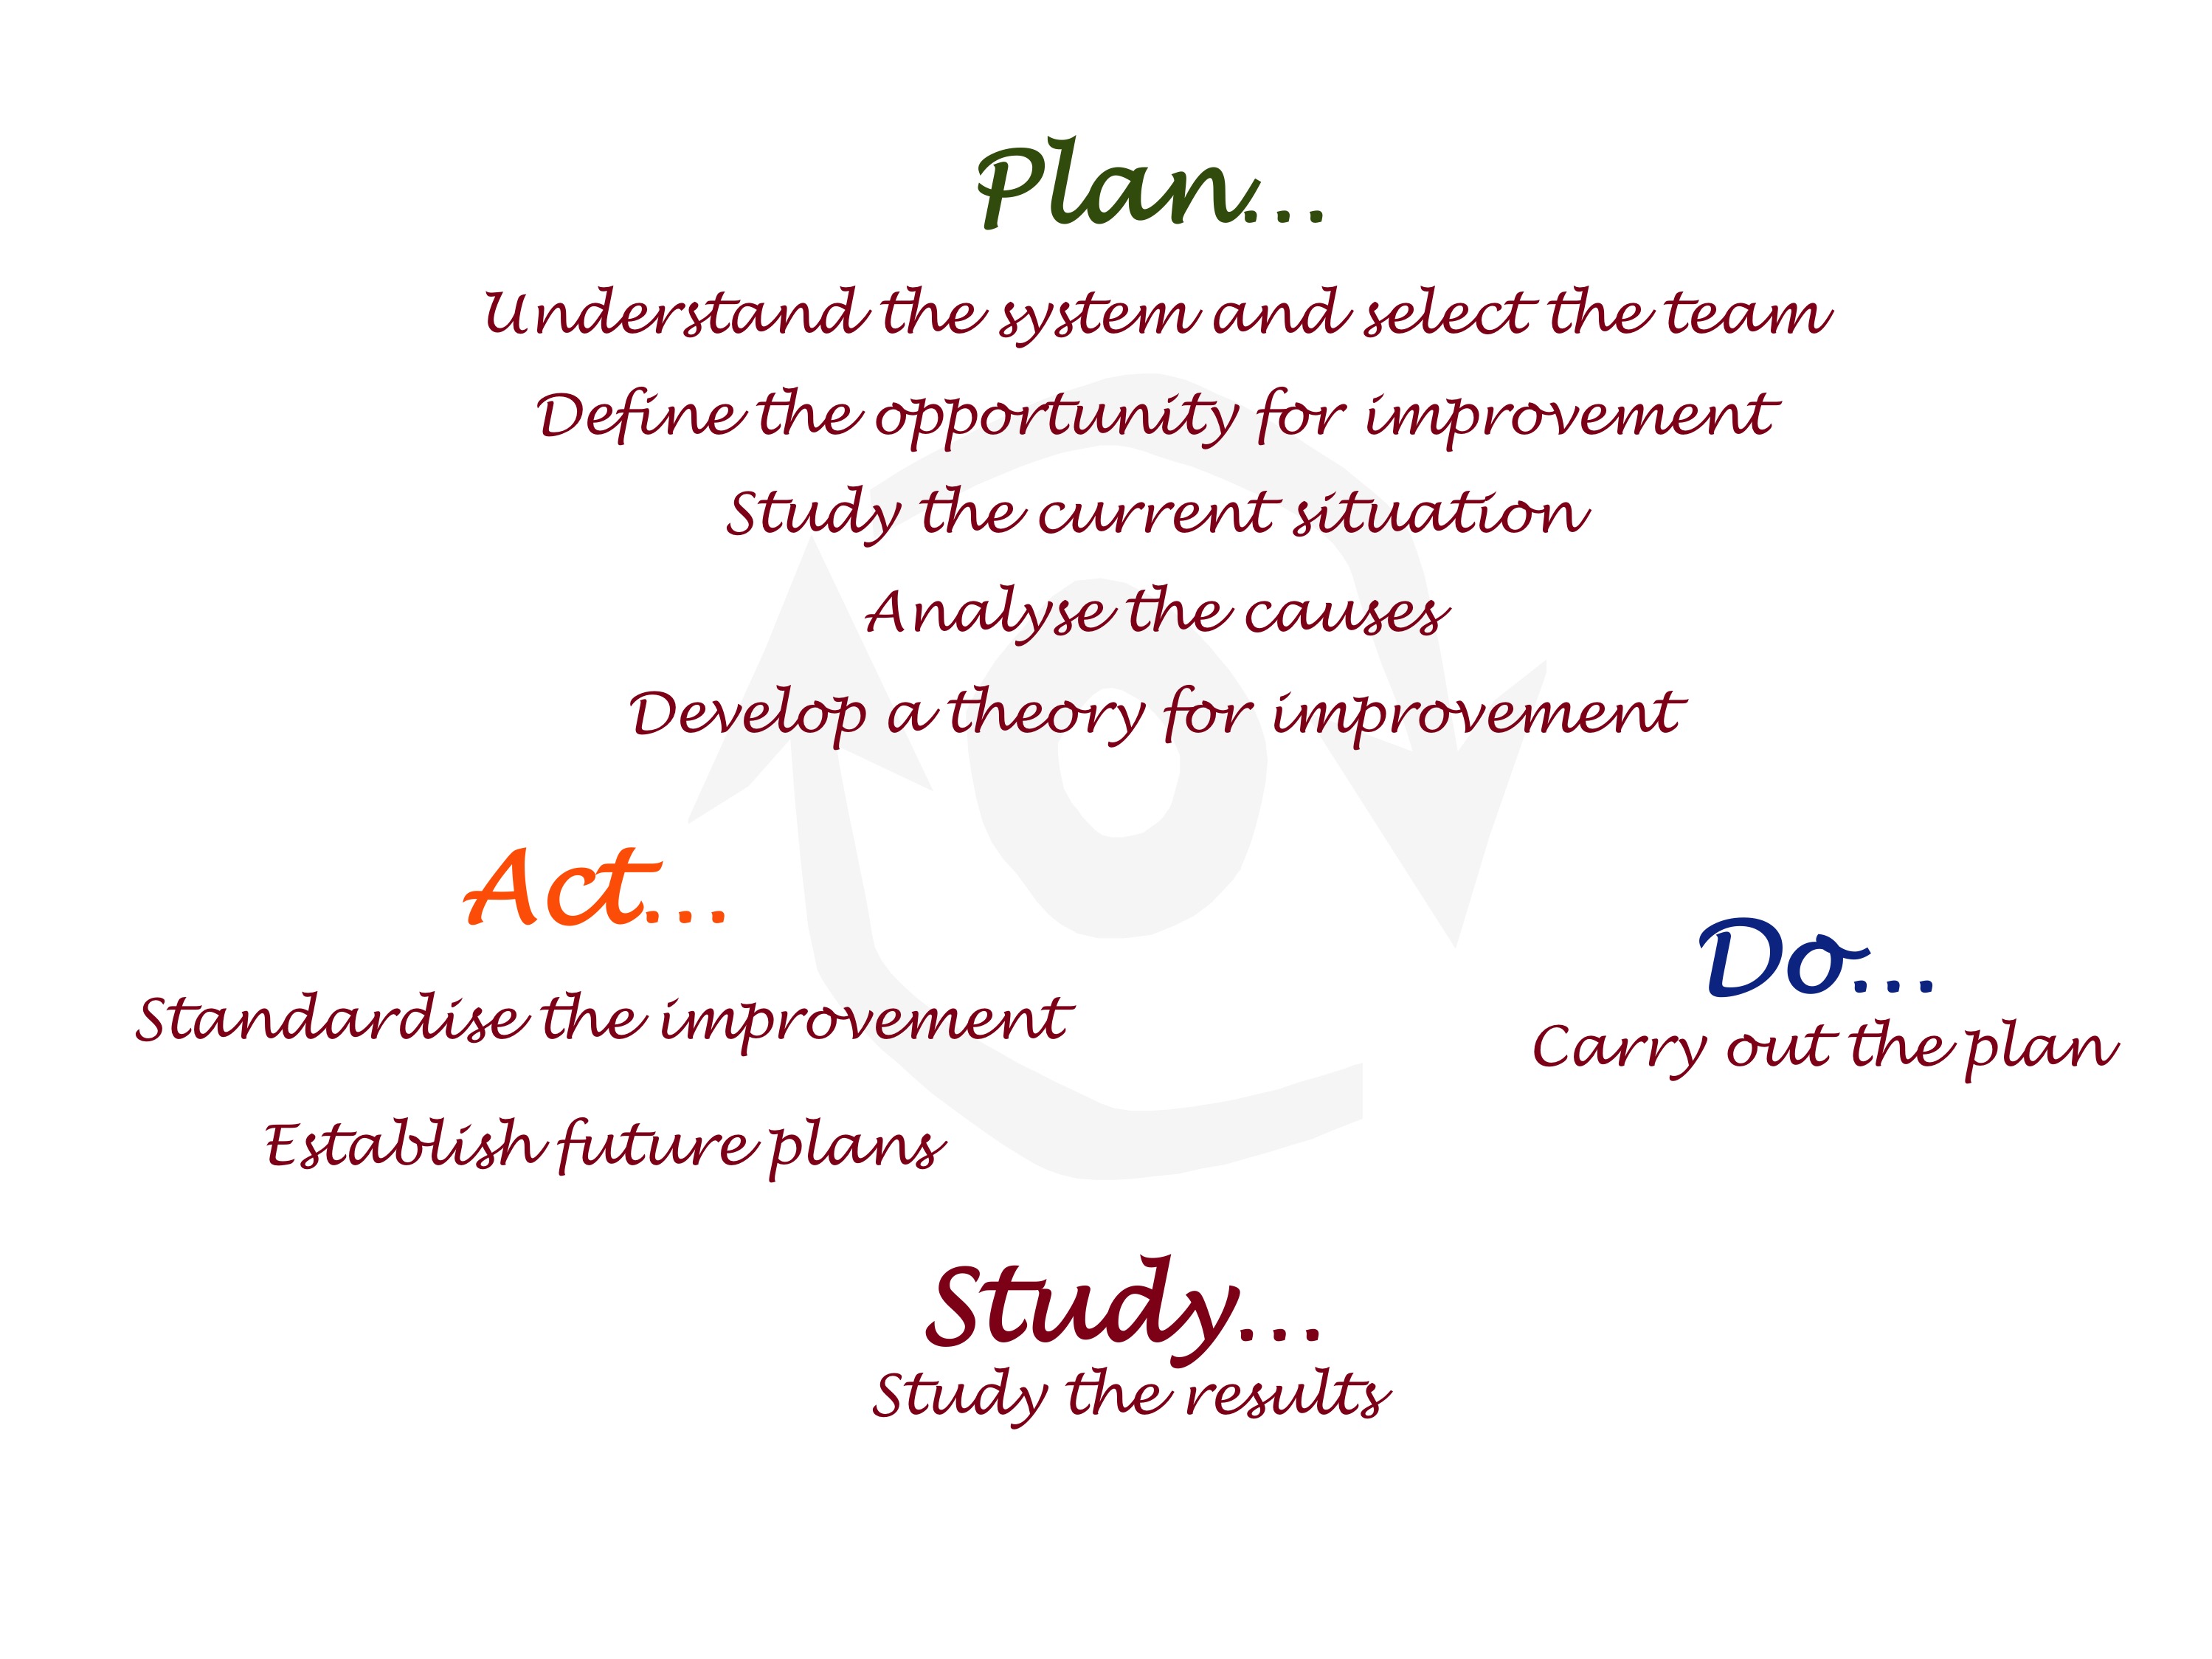
A nine step PDSA process
This includes:
defining the opportunity for improvement by agreeing the purpose and establishing a shared vision of excellence
focusing improvement efforts on a system or process (rather than blaming individuals)
identifying root causes not symptoms
developing and applying a theory for improvement
reflecting on the outcomes achieved to agree a new ‘best method’ or further improvement needed.
Here’s how…
Chris applied the PDSA process with her students. They documented a comprehensive storyboard to capture their agreements, the data collected, and to reflect their progress in applying the PDSA process.
Here’s what they did:
Students and teachers discussed to agree the opportunity for improvement – to improve their PE classes.
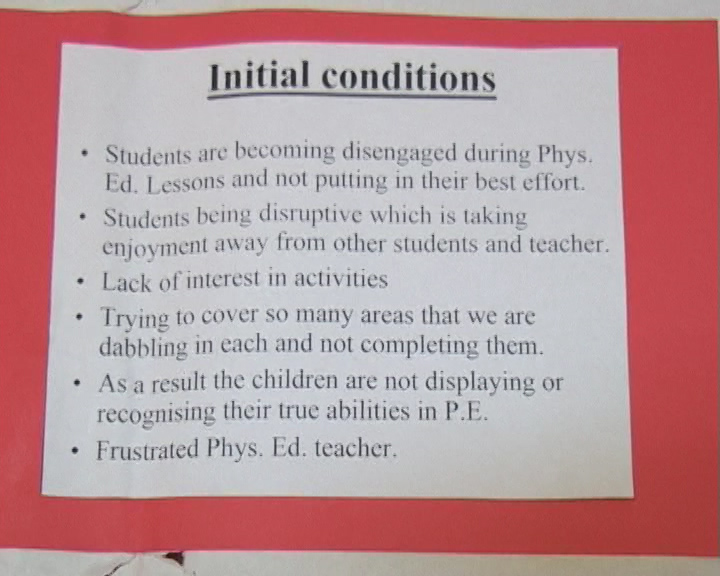
They studied the current situation – what did PE currently look like, feel like, and what was going on? They agreed: students were disengaged, disinterested and not putting in their best efforts; some students were disrupting the class, preventing others from enjoying PE; and teachers were frustrated.
PDSA storyboard extract: brainstorm of the current situation in PE
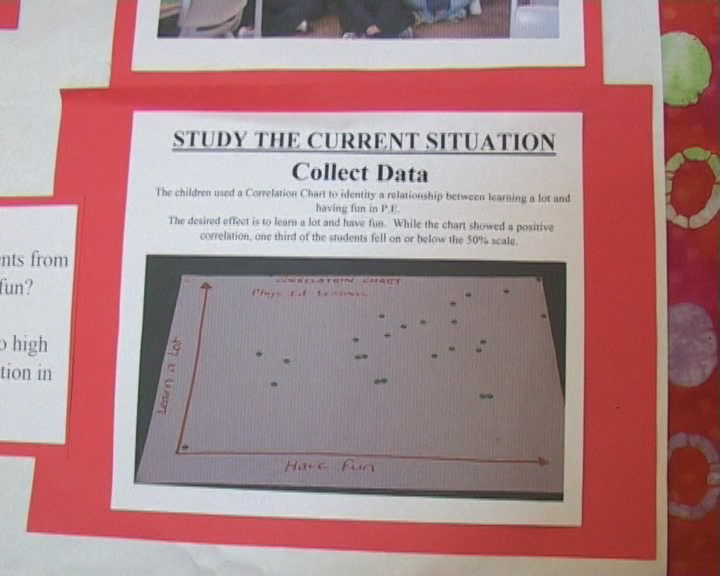
They collected data to measure the extent of the dissatisfaction with PE. A correlation chart was used to measure student
PDSA storyboard extract: collecting data using a correlation chart – how much are students enjoying and learning in PE?
perception. The data revealed low levels of student enjoyment
(fun) and learning in the PE classroom.
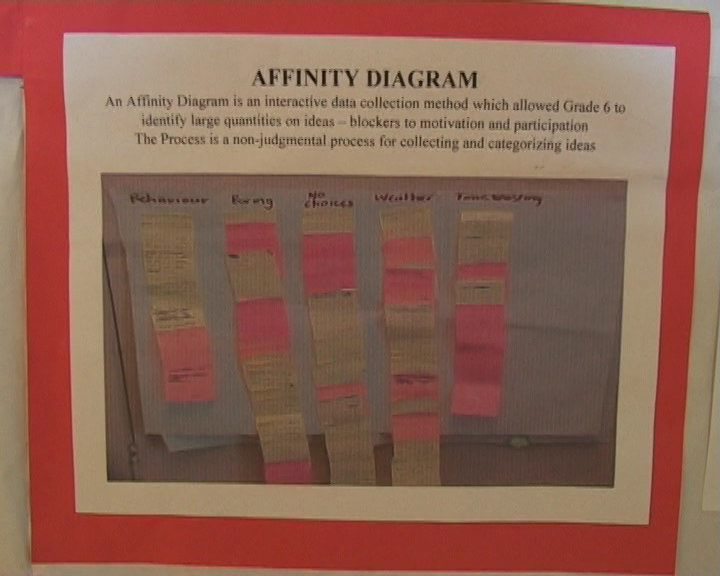
Students then brainstormed and themed the drivers and barriers associated with motivation and participation in their PE classroom. They used sticky notes and an affinity diagram to facilitate this. The major barriers they identified were: ‘inappropriate behaviour’, ‘boring classes’, ‘lack of student choice’, ‘the weather’ and ‘wasting time’.
PDSA storyboard extract: affinity diagram of the barriers to student motivation and participation in PE
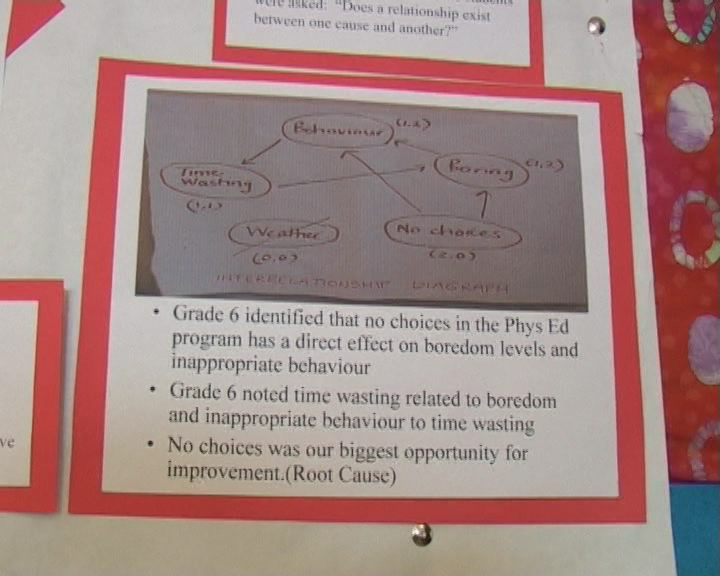
These barriers were analysed to agree the root causes using an interrelationship digraph. (They knew that by working on the root causes of their problem that they would realise the greatest return on their improvement efforts.) For the PE students this revealed ‘lack of choice’ as the major or root cause. A lack of choice by students in their PE lessons was seen as a major barrier to participation and motivation. It was impacting upon the other causes and driving the observed problems with behaviour and performance in their classroom.
PDSA storyboard extract: interrelationship digraph analysing the root causes of a lack of student motivation and participation in PE
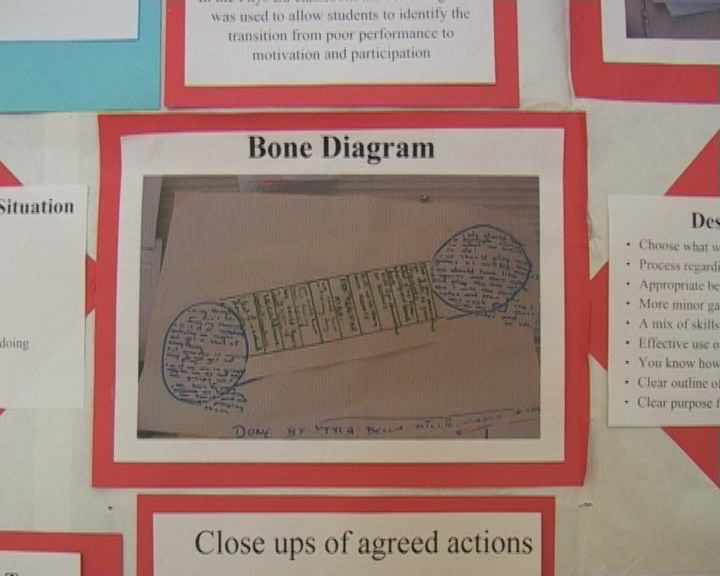
A bone diagram was used with students to further explore the current situation, and to agree a vision of excellence for PE – what they wanted PE to be like. The resulting student vision showed students believed: student choice, a clear purpose and process for each session, appropriate behaviour, more minor games, a mix of skills, effective use of time, student’s understanding what was expected, and knowing whether they were improving; were the key characteristics students believed were essential for a great PE lesson.
PDSA storyboard extract: bone diagram agreeing a vision of excellence for PE
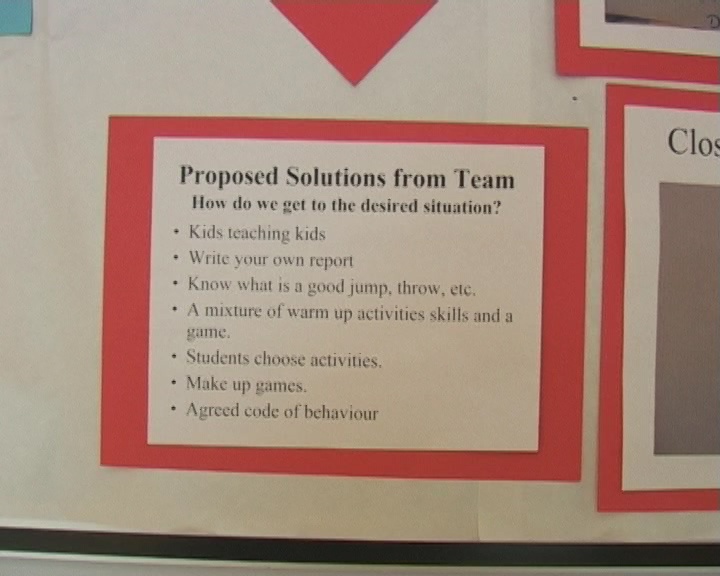
They brainstormed possible solutions which included: ‘kids teaching kids’, students ‘choosing activities’ and ‘writing their own report’, agreeing a student ‘code of behaviour’, clarifying expectations (quality criteria: ‘know what a good throw, jump looks like’), and students ‘making up games’.
PDSA storyboard extract: brainstorm of possible solutions to improve PE
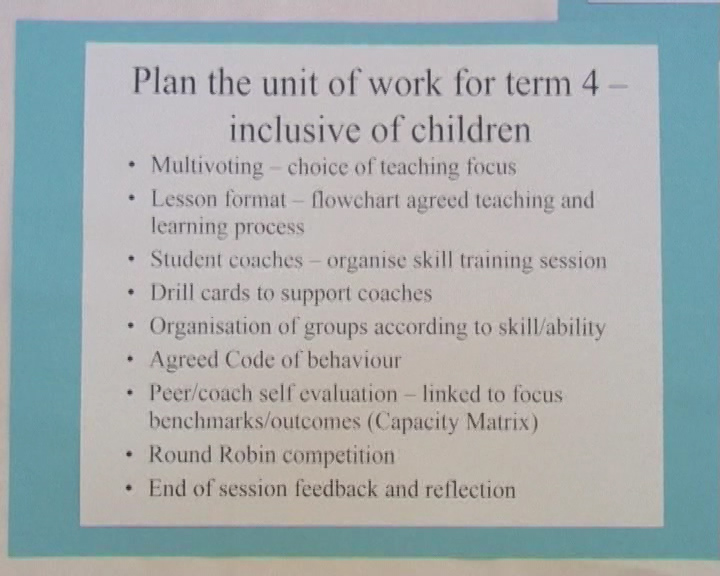
These solutions helped them to develop a ‘theory for improvement’ comprising the following key strategies:
multi-voting to agree the focus of each lesson
agreeing the lesson format – flowcharting the teaching and learning process
appointing student skill coaches and documenting skill cards to help the coaches do their job
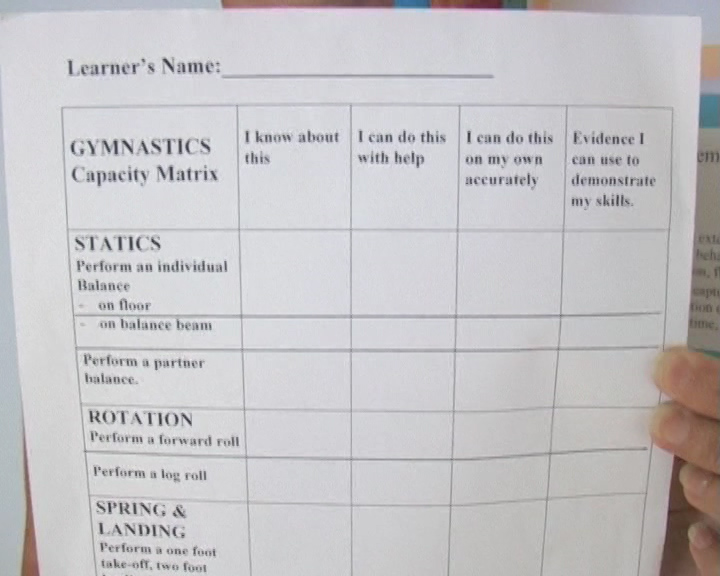
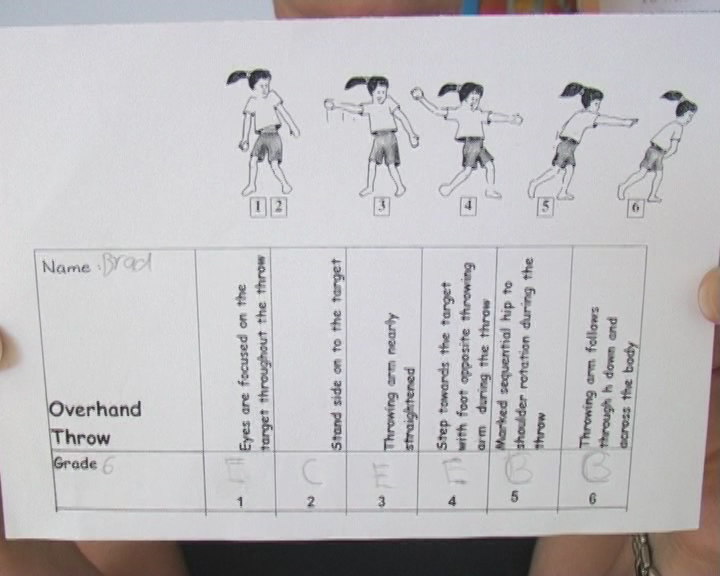
students undertaking peer evaluation together with their teacher/coach. They developed capacity matrices for key areas of learning to help them to do this. They also documented quality criteria describing how to execute essential skills with a high degree of excellence (e.g. how to do an overhand throw). Students used the capacity matrices and quality criteria as the basis for reflection and evaluating their progress in PE
agreeing a code of behaviour
everyone reflecting and giving feedback after each lesson.
PDSA storyboard extract: agreed strategies to improve PEPE – capacity matrix for gymnasticsPE – quality criteria for an overhand throw
The outcome?
The PE classes applied the agreed strategies and new processes, and a few weeks later reflected on the effectiveness of the improvements they had made (the ‘study’ phase of the PDSA
process).
Behaviour and engagement improved. Students were motivated and learning
Students ‘owned’ and were running the PE lessons with minimal guidance from PE teachers! They were responsible for their learning
PE lessons had a productive ’buzz’! Students were excited. Teachers were happy.
The processes they had developed together were adopted as the new way for PE lessons.
Chris described the PDSA based collaborative process as having an amazing impact.
Applying the PDSA process, working ‘with the kids’ and not ‘doing to the kids’, brought about significant positive change to PE lessons – improving the way teachers were teaching and students were learning – to great effect!
Quality learning provides administrators, educators, and students with the thinking and practical quality improvement tools necessary to continually improve schools, classrooms and learning. The Consensogram is one of these powerful and easy-to-use quality improvement tools.
A consensogram
The Consensogram facilitates collaboration to support planning and decision making through the collection and display of data. It can be used to gain important insights into the perceptions of stakeholders (most often relating to their level of commitment, effort, or understanding).
The quick-to-construct chart reveals the frequency and distribution of responses. Although anonymous, it allows individuals to view their response in relation to the others in the group.
The Consensogram gives voice to the silent majorityand perspective to the vocal minority.
At QLA, we use frequently use the Consensogram: applying it to diverse situations for the purpose of obtaining important data to better inform ‘where to next’.
How to
Predetermine the question relating to the data to be collected. Make sure the question is seeking a personalised response – it contains an “I” or “my” or “me”. We want people to give their view. E.g. “To what degree am I committed to…” or “To what degree do I understand…” It can help to begin the question with ‘To what degree…’
Predetermine the scale you wish to use. The scale may be zero to 10 or a percentage scale between zero and 100 percent.
Issue each person with one sticky note. Make sure the sticky notes are all the same size. Colour is not important.
Explain that you want people to write a number on their sticky note in response to the question posed.
No negative numbers.
If using the zero to 10 scale: the number should be a whole number (not a fraction e.g. 3¾ or 3.75, 55%), and a six or nine should be underlined so they can be distinguished.
If using the zero to 100% scale, the numbers should be multiples of ten percent, i.e. 0%, 10%, 20%, and so on.
Names are not required on the sticky notes.
Ask people to write down their response. This shouldn’t take long!
Collect the sticky notes and construct the Consensogram, usually on flip chart paper. Label the consensogram with the question and a vertical axis showing the scale.
Interpret the Consensogram with the group and use it to inform what to do next.
Capture a record of your Consensogram by taking a photograph or saving the data on a spreadsheet. You can use a Consensogram template.
Some examples
Students feeling prepared for high school
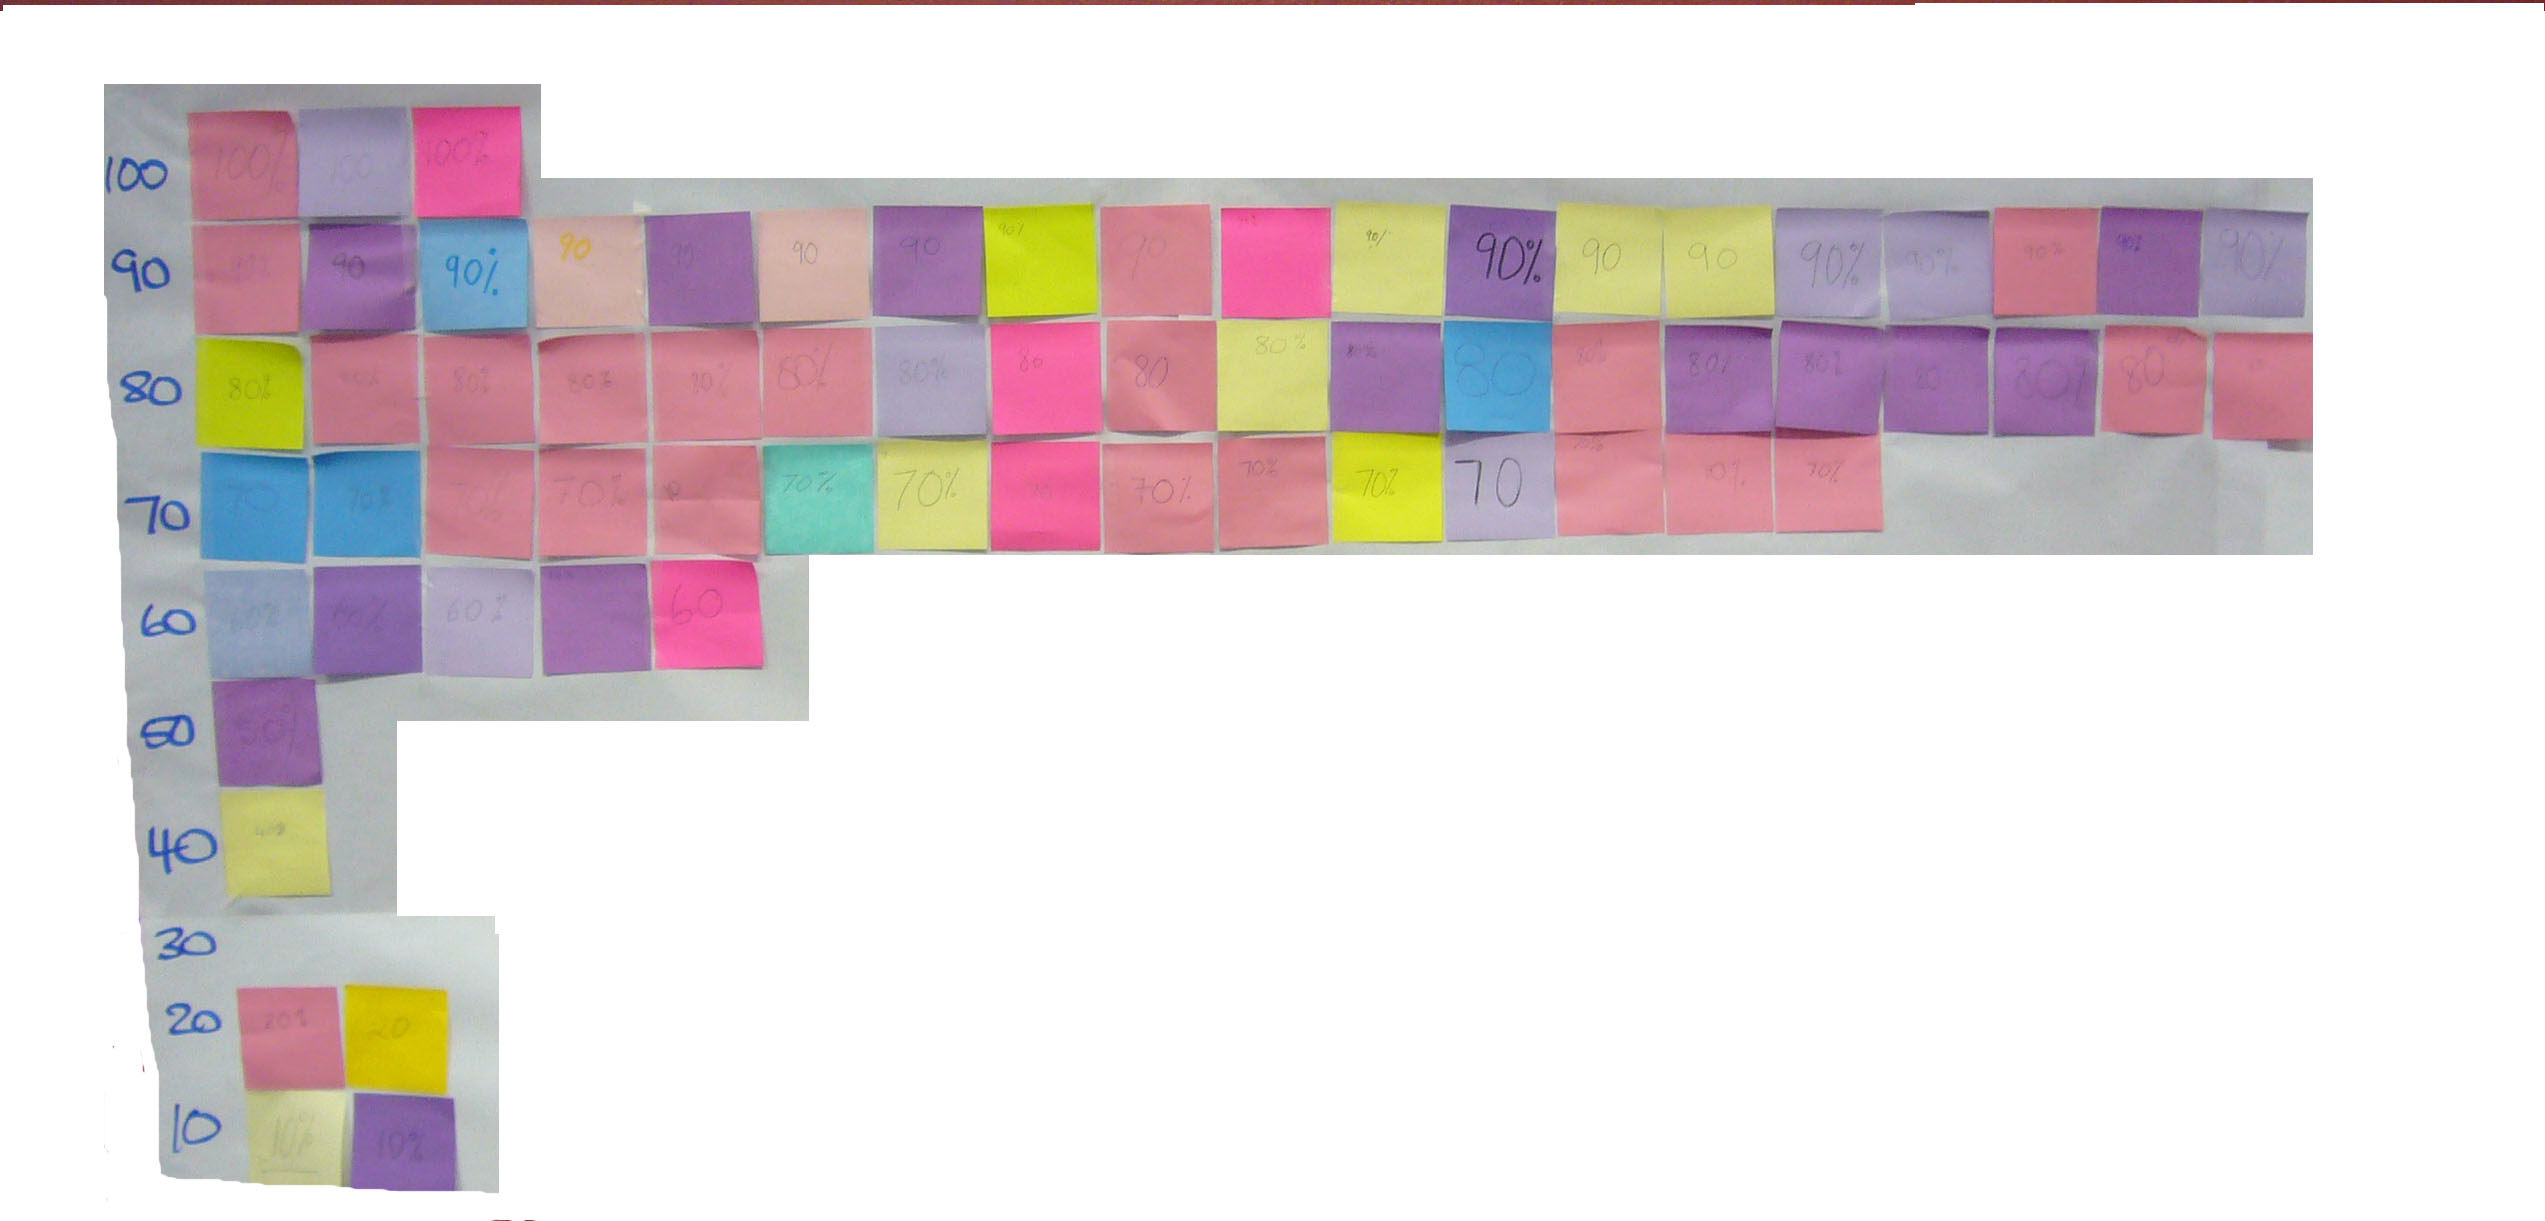
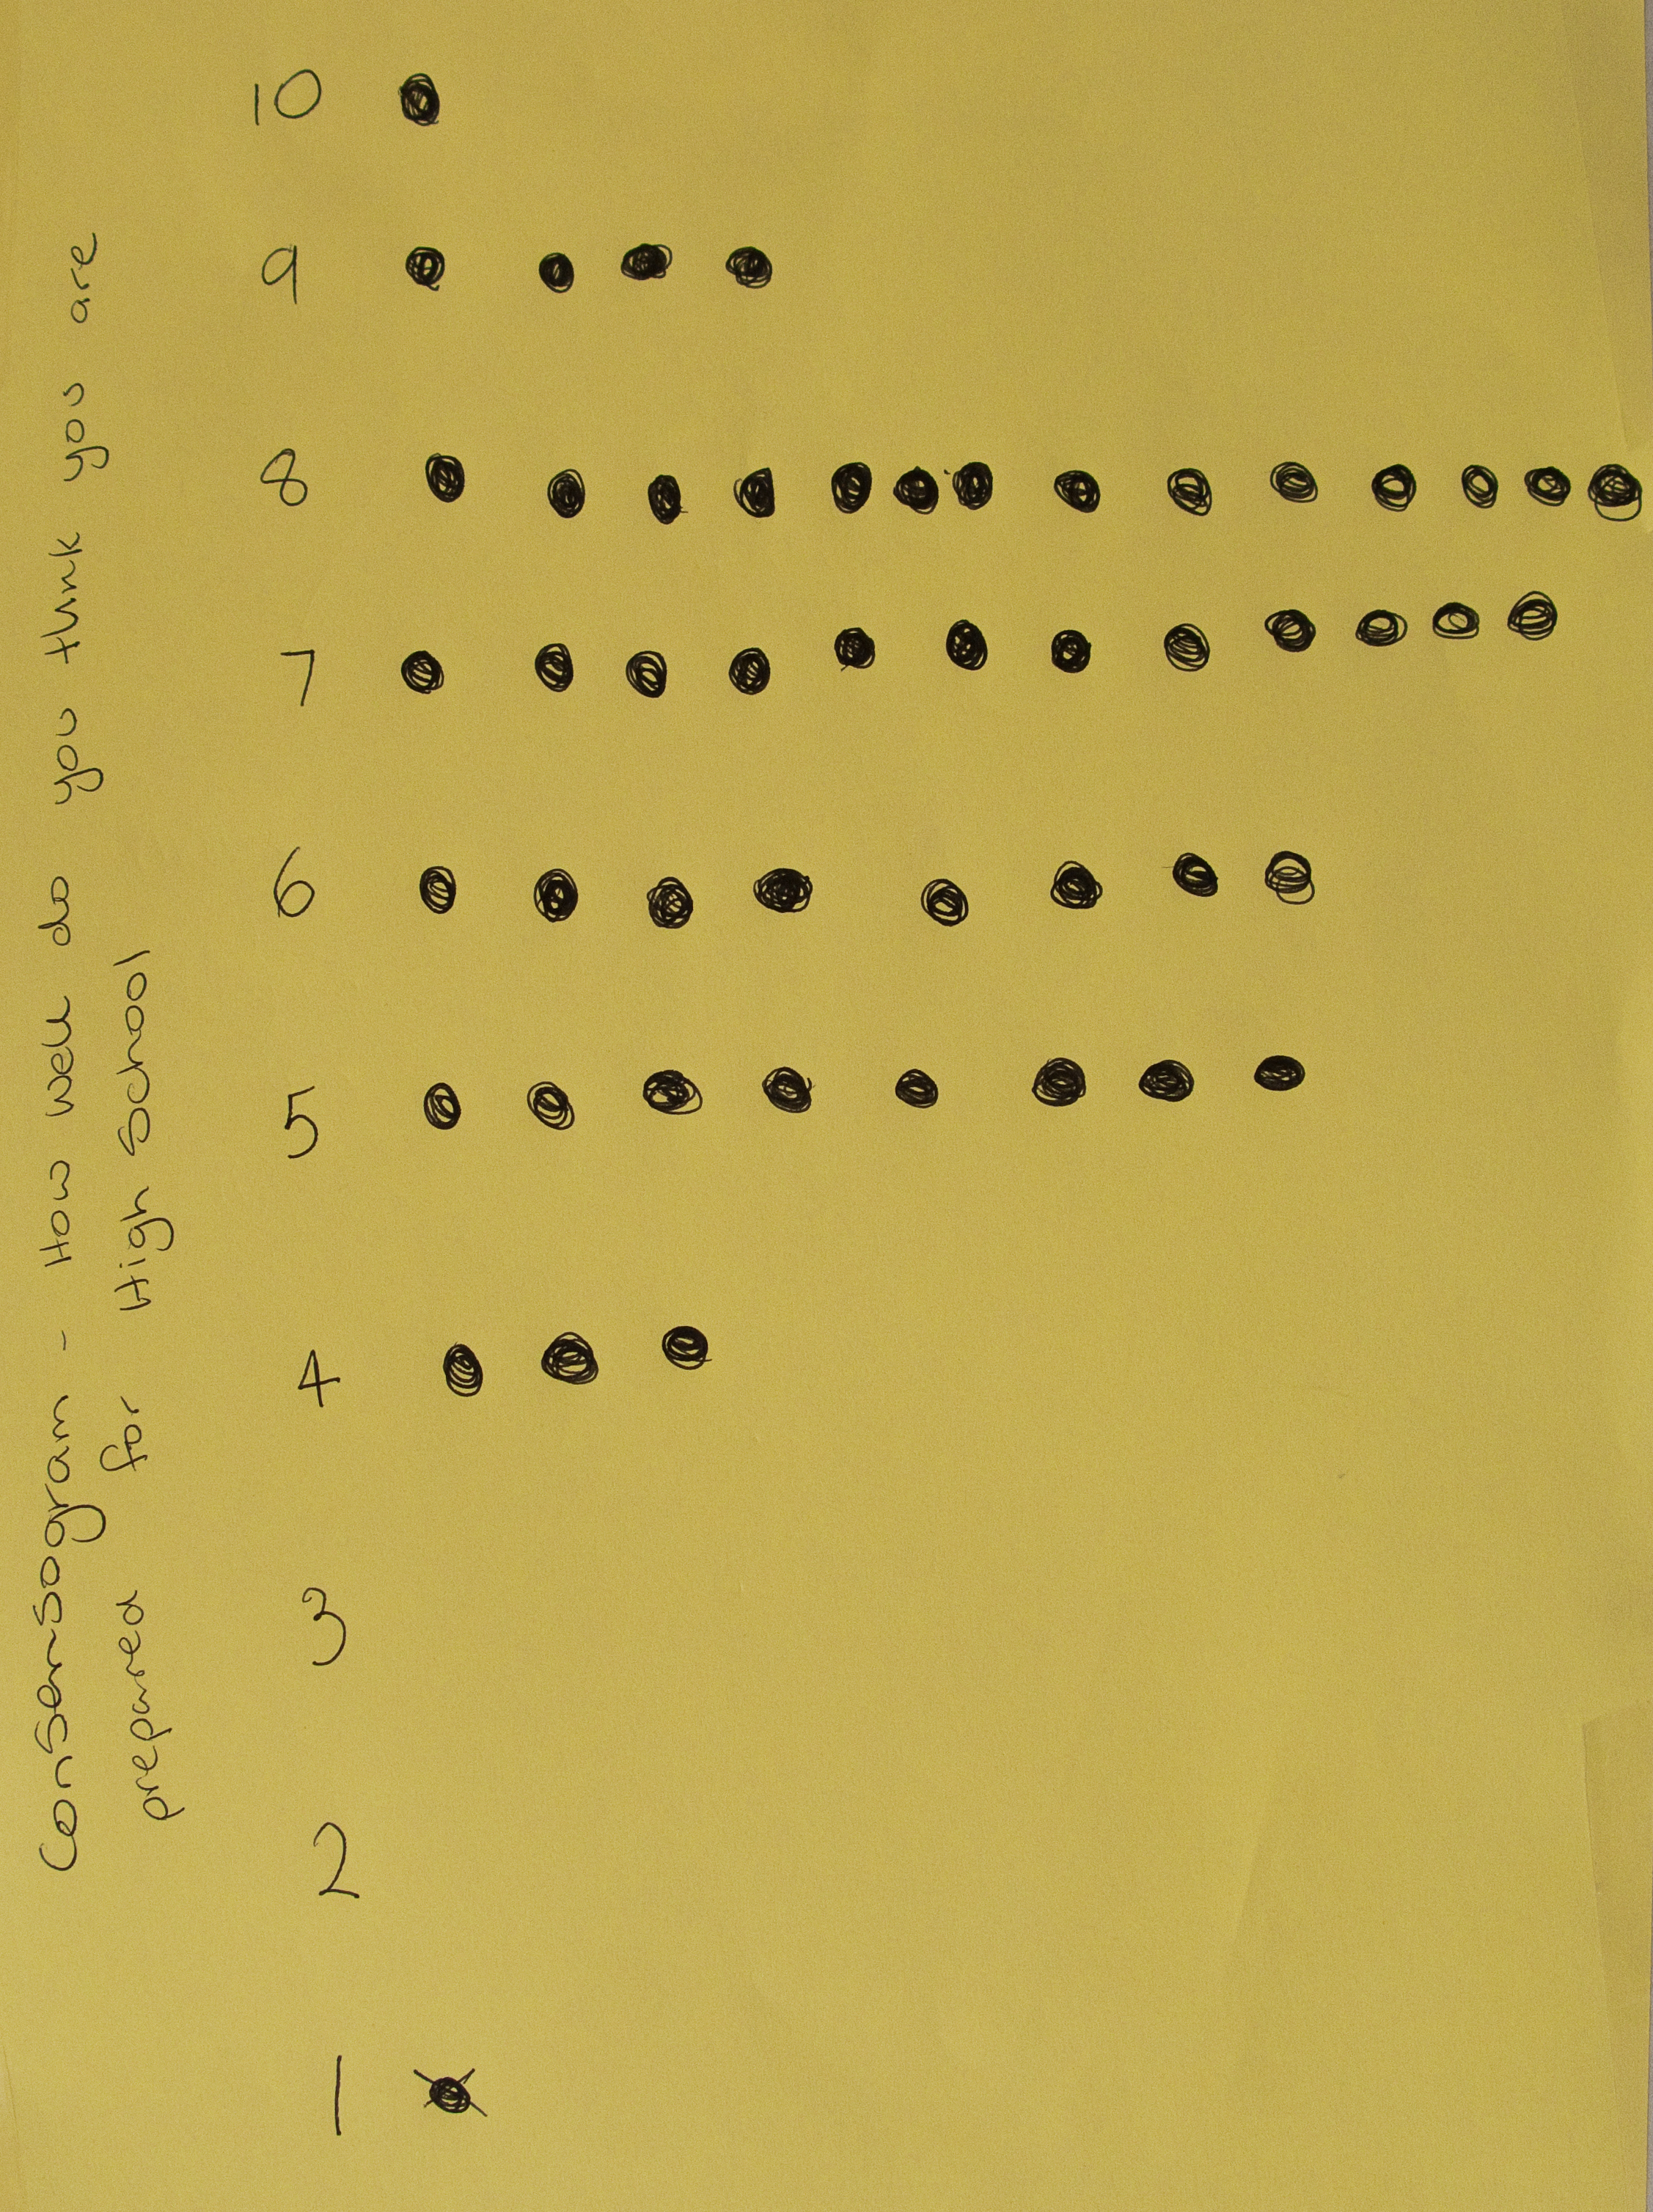
Consensogram: students feeling prepared for high school
This first example was prepared by a classroom teacher to determine how confident Year 6 students were feeling about their transitioning to high school.
So what do the data reveal?
There is significant variation; the students believe they are prepared to different degrees for their move to high school (scores range from 10 to 4).
There is one outlier (special cause) – that is; one student who is having a very different experience to others in the class (giving a rating of one). They report that they feel unprepared for the transition.
So where to next?
There is opportunity to improve student confidence by working with the whole class to identify and work together to eliminate or minimise the biggest barriers to their feeling prepared.
There is opportunity to invite the student who is feeling unprepared to work with the teacher one-on-one (case manage) to address their specific needs for transiting. This student should not be singled out in front of the class, but an invitation issued to the whole class for that individual to have a quiet word with the teacher at a convenient time. The ensuing discussion may also inform the transitioning process for the rest of the class.
Student engagement
This example was created during a QLA professional development
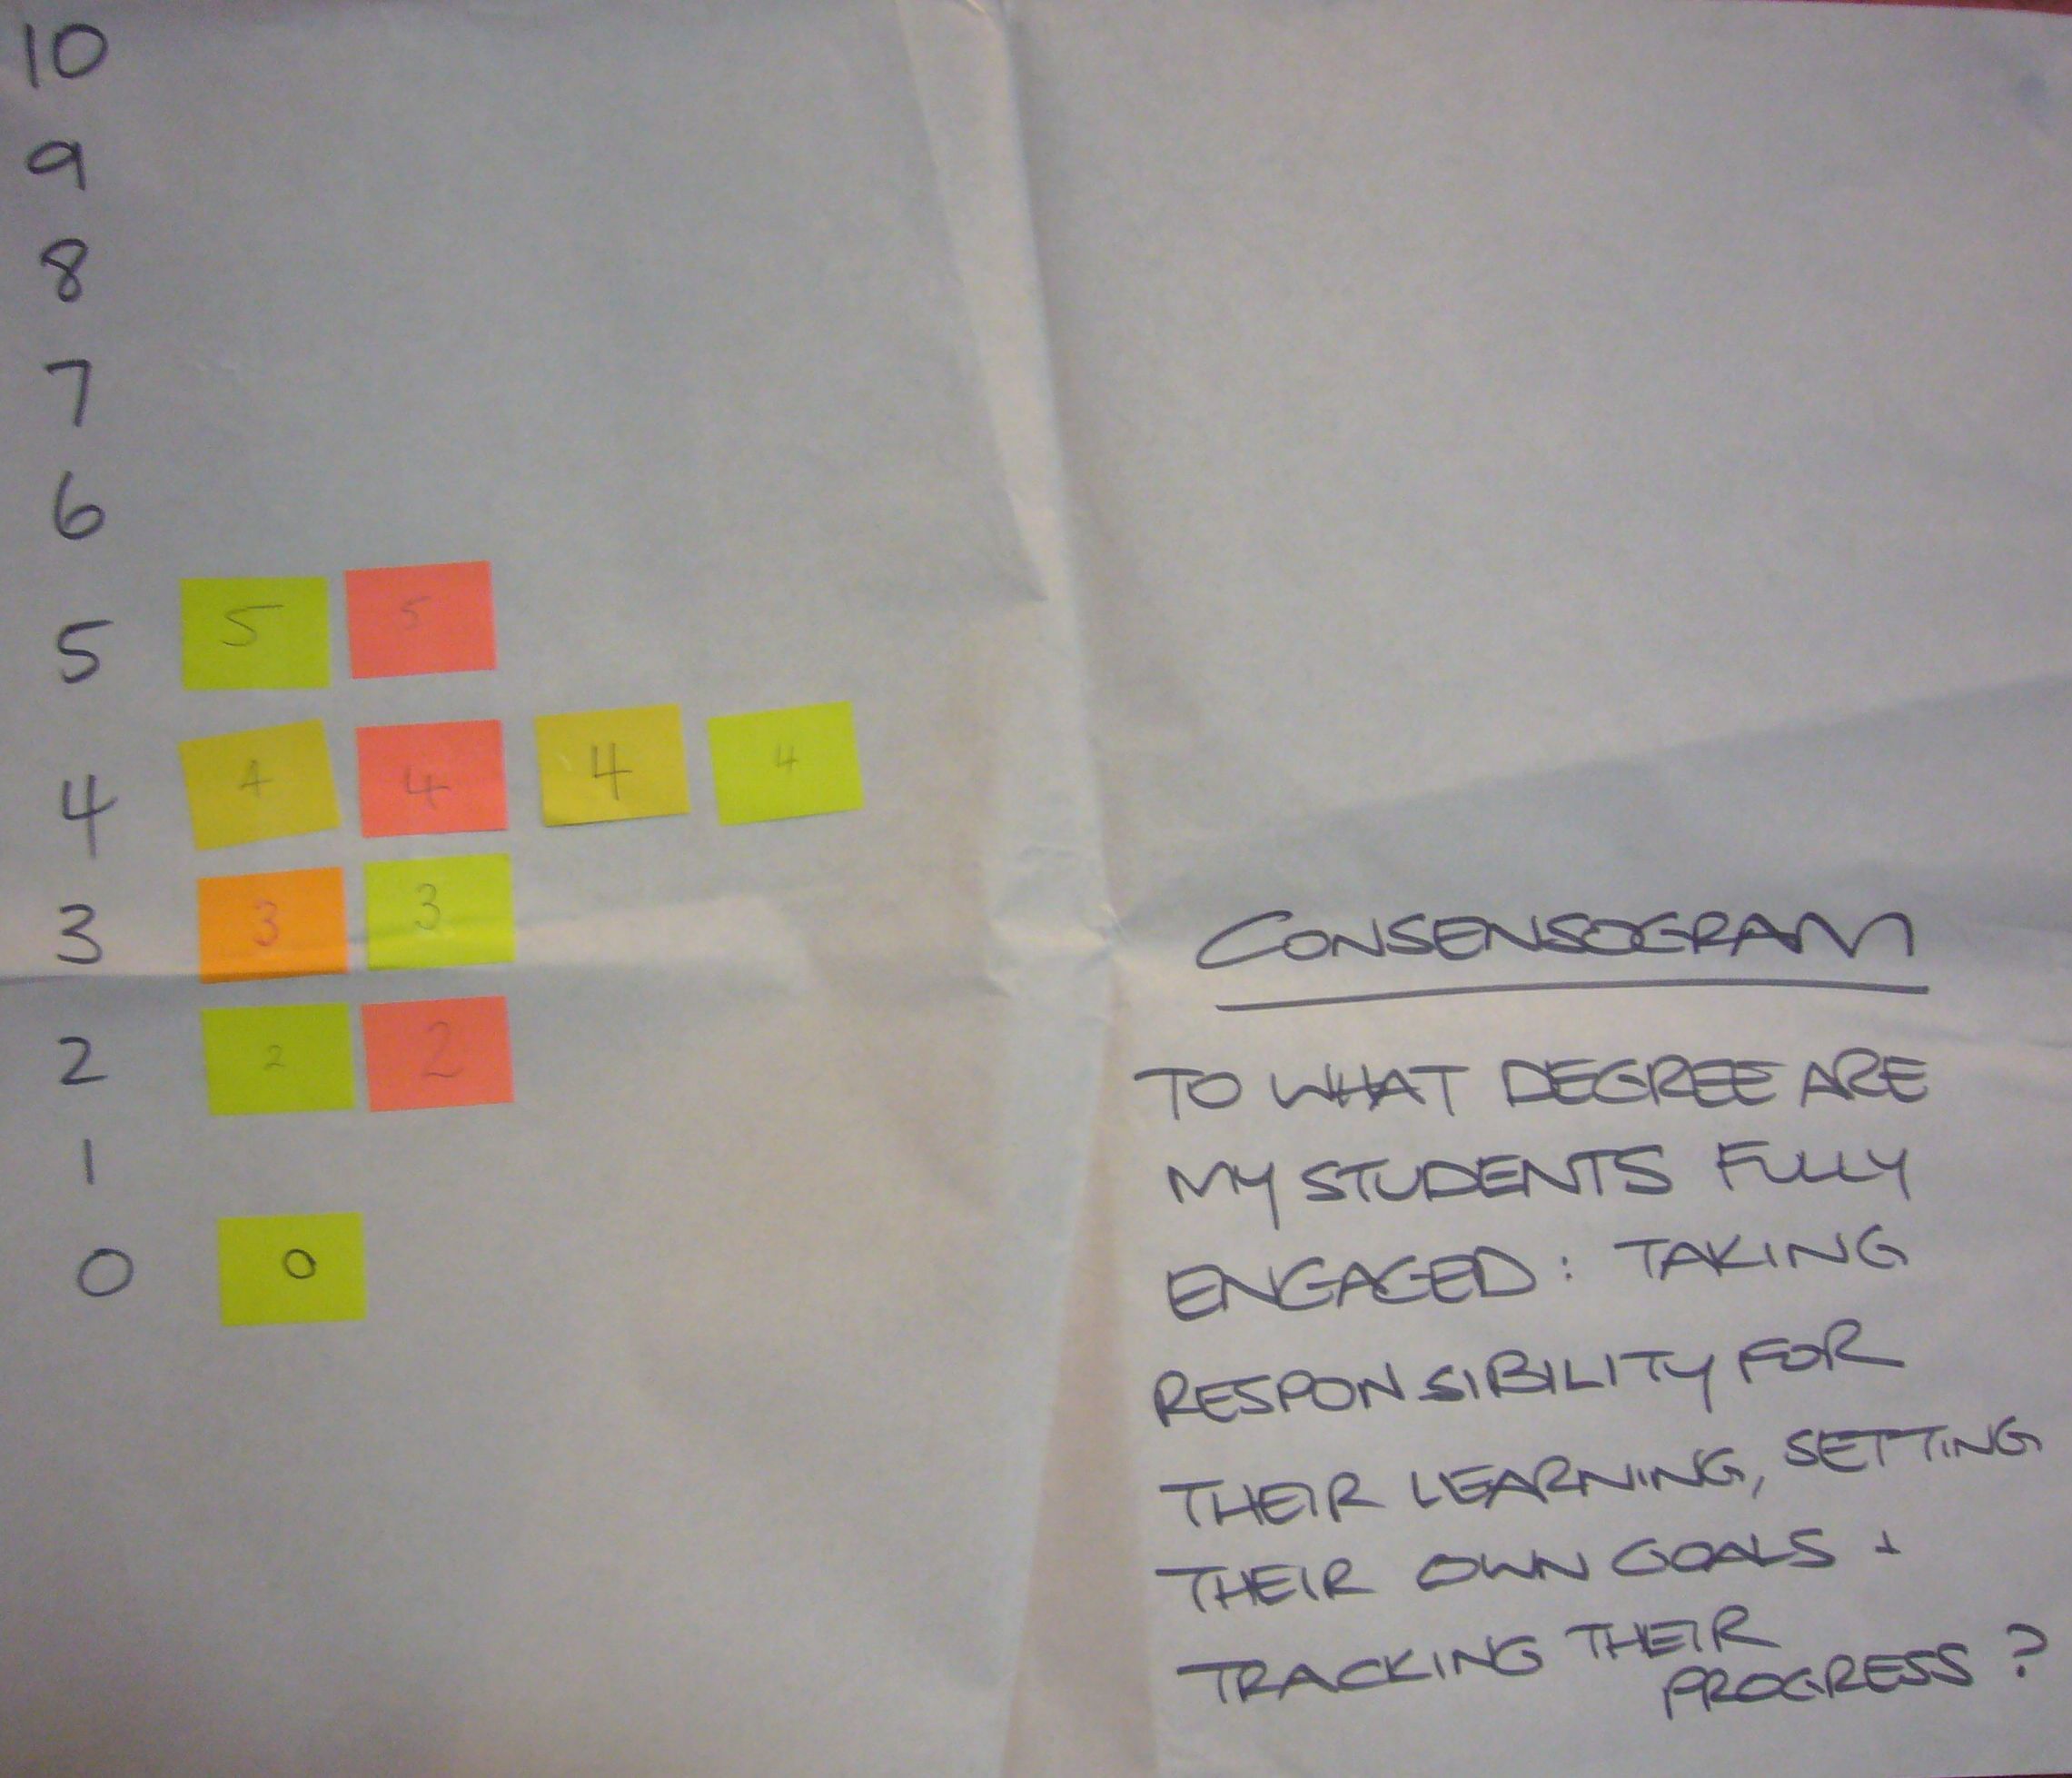
Consensogram: how engaged are students in my classroom?
workshop with a small group of 11 teachers.
The question was: “To what degree are my students fully engaged: taking responsibility for their learning, setting their own goals and tracking their progress?”
So what do the data reveal?
There is variation; the teachers believe their students are at different levels of engagement in their classroom.
The data appears normally distributed data (a bell curve); there are no outliers (special causes) – that is; none of the teachers are having a very different experience to others in the group.
So where to next?
There is opportunity to improve student engagement; all of the data points are below 5 on the scale.
This data can help the group to understand the agreed current state and can motivate people to engage with improvement. It can also provide baseline data to monitor the impact of improvement efforts in the future.
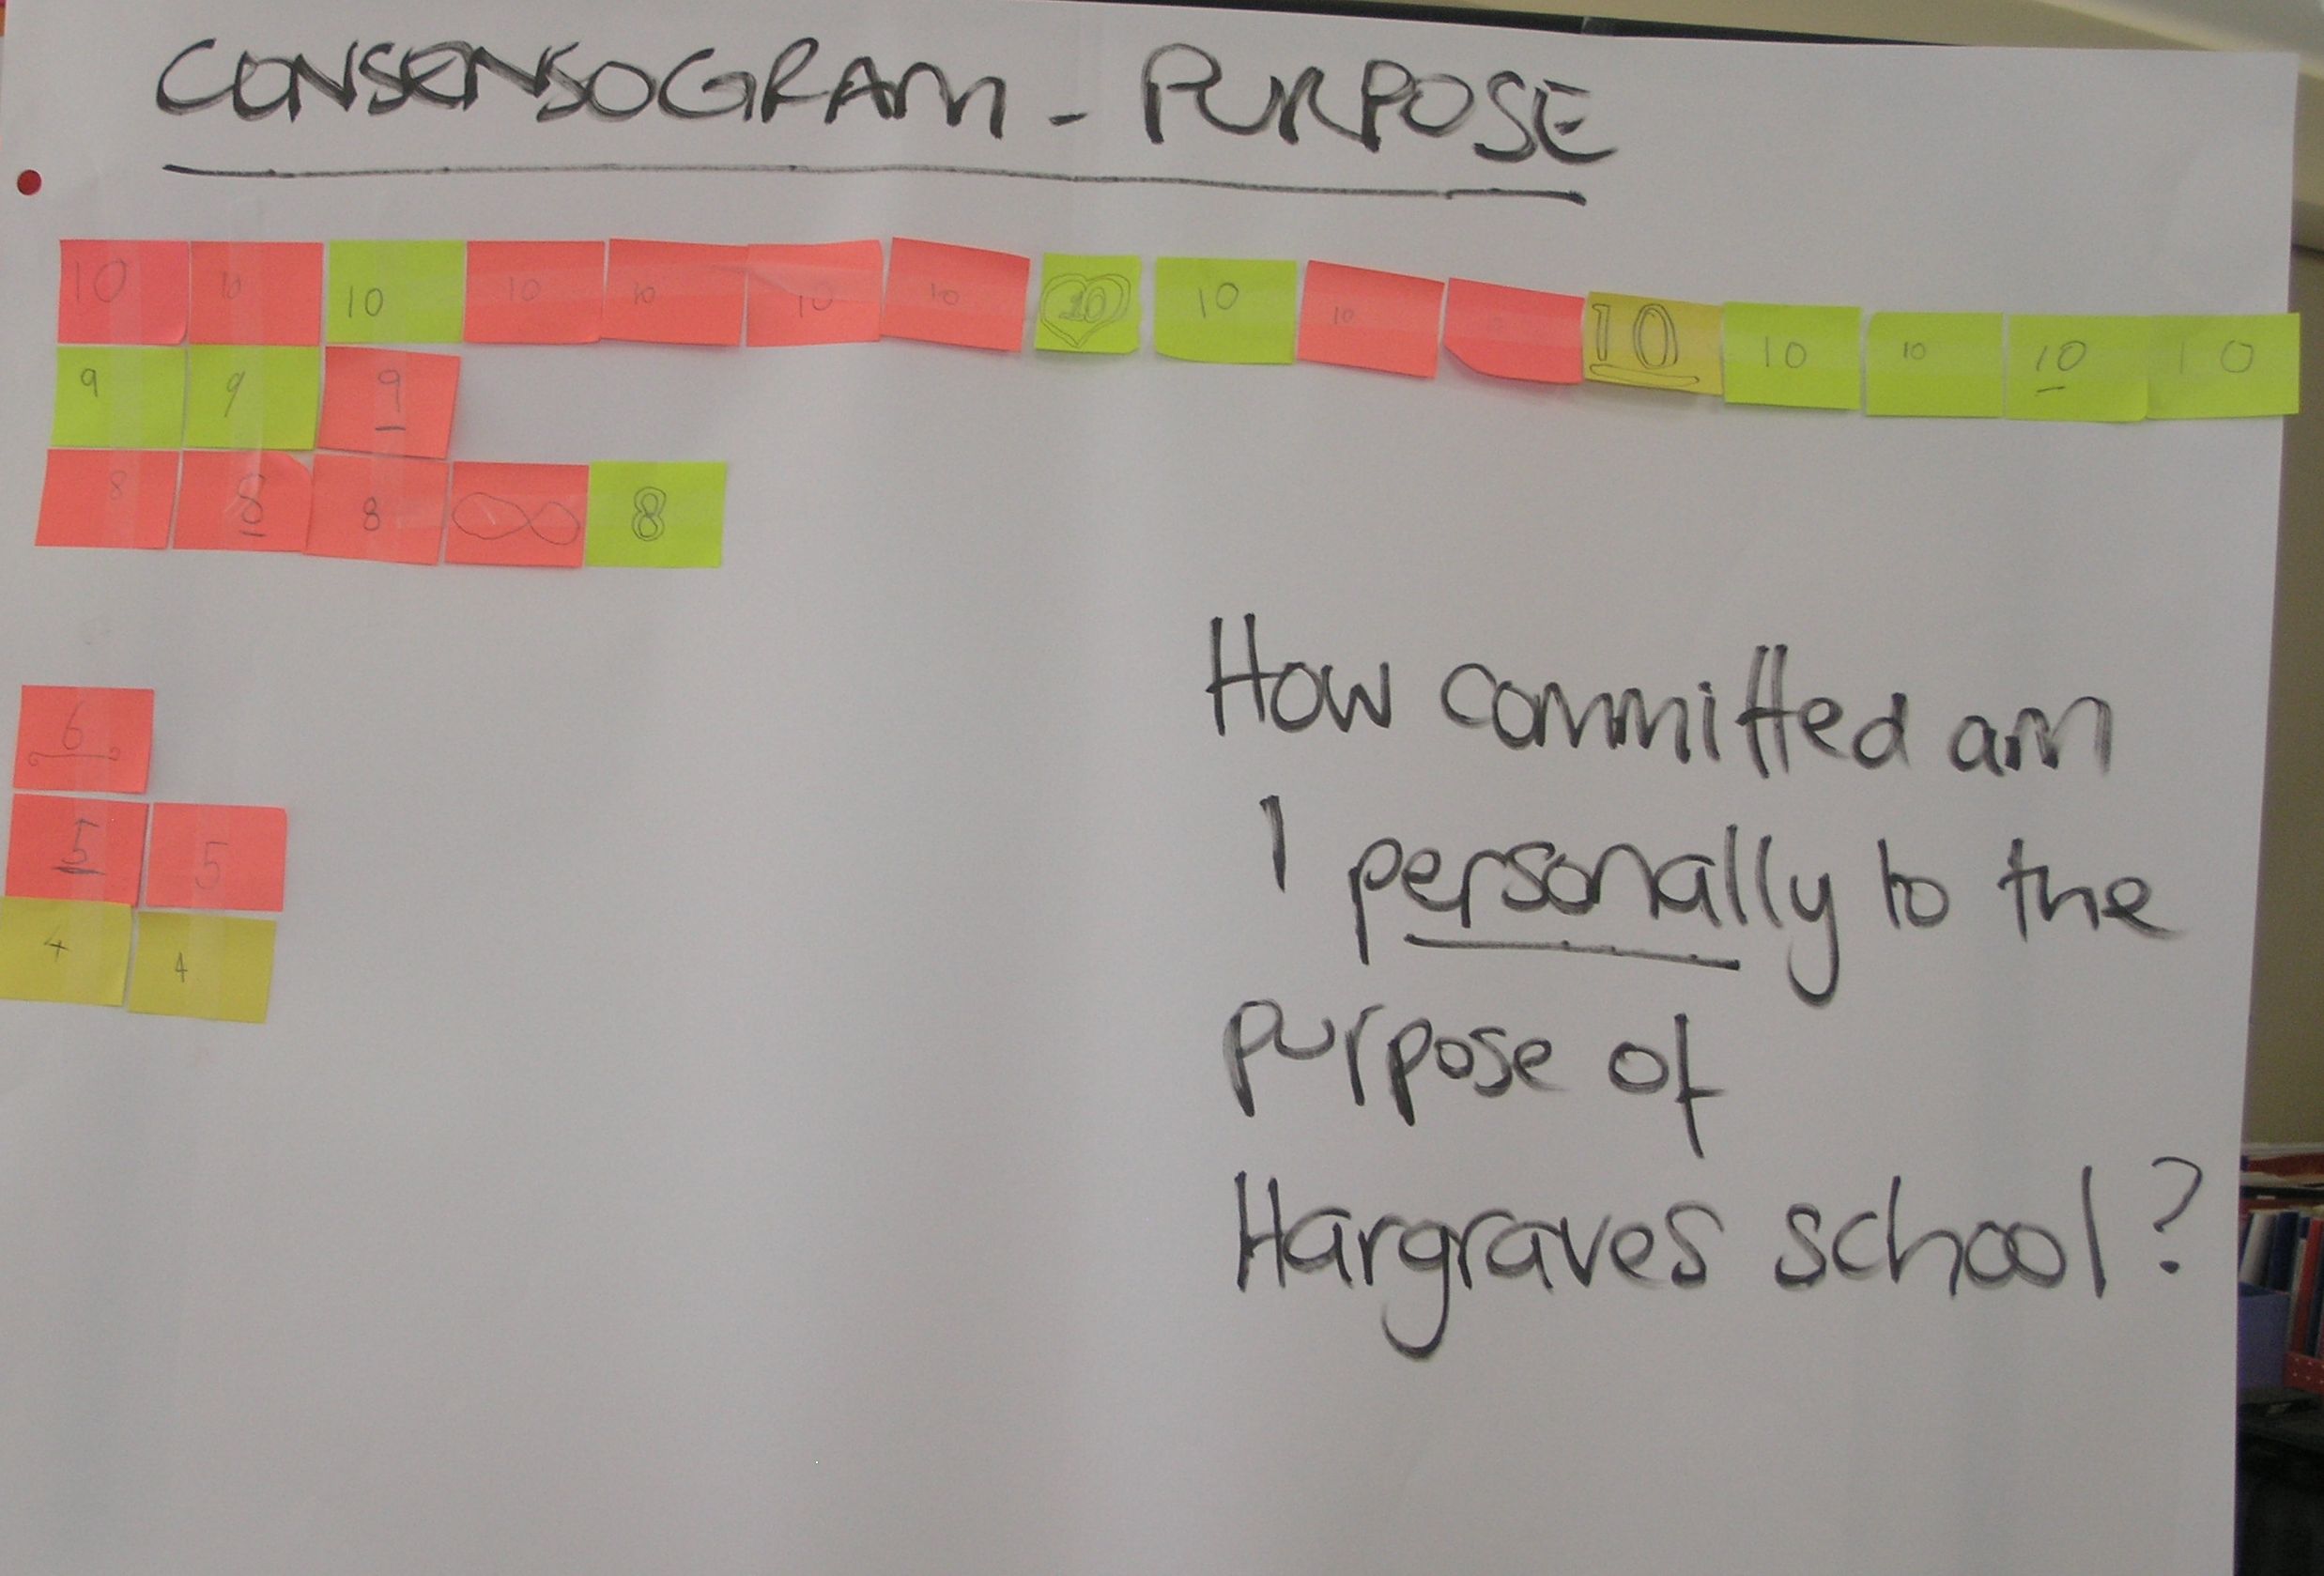
Commitment to school purpose
This example was created during school strategic planning with key stakeholders of a small school (parents, staff and students). A draft
Consensogram: how committed am I to our school purpose?
purpose statement was developed using stakeholder input (using a P3T Tool). The Consensogram was then used to measure the level of commitment to the draft statement. The question was: “How committed am I personally to the purpose of the school?”
The use of the Consensogram averted the need for long, frequently unproductive dialogue. It revealed the following:
There is variation; the stakeholders exhibit different levels of commitment to the school purpose.
Most are stakeholders are highly committed (the majority indicating a commitment level of 8-10).
A group of five stakeholders are less committed (a commitment level of 4-6). Their experience may be different to others in the group.
So where to next?
This presents an opportunity to invite the stakeholders with a different experience to share. It is very likely something can be learned to improve the purpose statement for everyone.
Learn more…
Watch a video example of a Consensogram being used for school planning (Hargraves System Mapping) on YouTube.
The assessment dimensions of Approach-Deployment-Results-Improvement (ADRI) can be very helpful for self-assessment. ADRI provides a structure under which the activities and results of an organisation can be broken down to identify, quite specifically, where the strengths and opportunities for improvement may lie.
ADRI provides a structured approach to organisational self-assessment. The ADRI dimensions help you to analyse how your organisation goes about: thinking and planning (Approach); implementing and doing (Deployment); monitoring and evaluating (Results); and reviewing and improving (Improvement).
It is a feature of the Australian Business Excellence framework and underpins many other performance excellence frameworks around the world.
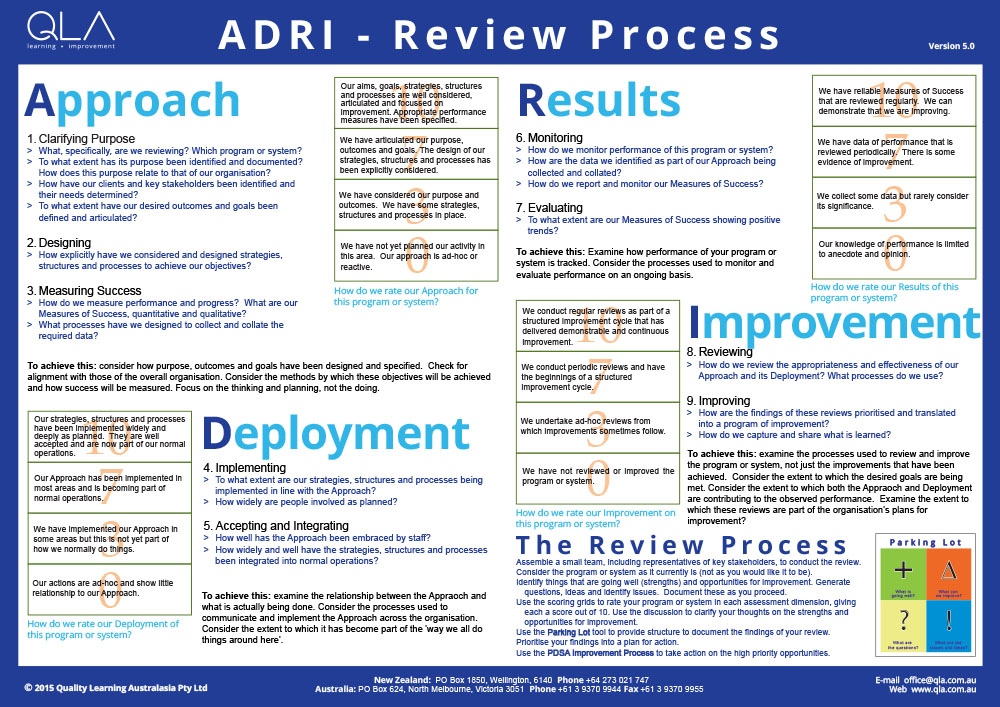
ADRI Review Process Poster for Self-assessment
Source: Adapted by QLA from the Australian Business Excellence Framework, the Malcolm Baldrige National Quality Awards Criteria and the European Foundation for Quality Management Excellence Model.
The ADRI assessment dimensions
Approach
Approach relates to the thinking and planning behind the area of endeavour – how it has been designed.
Considering an Approach leads to an examination of:
clarity of purpose
clients, key stakeholders and their respective needs
desired outcomes – the vision of excellence
design of strategies, structures and processes to meet the desired outcomes
identification of measures of success.
In most organisations the senior leaders, sometimes with the support of content specialists, determine the approach.
For example, senior leaders of a school, frequently with the help of a specialist curriculum committee, usually lead the approach to curriculum. It is the responsibility of these leaders to identify and make clear the purpose of curriculum in the school, the desired curriculum outcomes for the school, and to understand the needs of key stakeholders (including teachers, families and curriculum regulatory bodies). Armed with this understanding, the structures and processes (including documentation) necessary to meet the intentions of the school can be designed. It is during the design stage that the measures of success are also determined from the desired outcomes (the vision of excellence): what data will be used to monitor progress over time? Senior leaders do the thinking and planning – the design.
Deployment
Deployment relates to implementing and doing – how the design is put into effect.
Considering Deployment leads to an examination of:
the degree to which the designed strategies, structures and processes have been implemented across the organisation and down through the organisation
the extent to which staff understand and have embraced the organisation’s approach
how well the strategies, structures and processes have been integrated into the day-to-day operation of the organisation.
Those doing the daily work know most about how the daily work is done. Those that are expected to implement an organisation’s approach know most about it has been deployed. The school curriculum committee may have designed an excellent approach, but it is up to each classroom teacher to implement it. If classroom teachers are not adhering to the agreed school curriculum approach, it has not been deployed well.
Results
Results relates to monitoring and evaluating – how success is gauged.
Considering the Results dimension leads to an examination of:
how performance is monitored
how the data relating to the measures of success (determined as part of the Approach) are collected, collated and reported
the degree to which trends of improvement are evident in these data.
Monitoring and evaluating is a management responsibility. School leaders are responsible for monitoring and evaluating the data used as measures of success for their approach to curriculum. Unless these data are collected, collated and reported, the effectiveness of the approach and its deployment will be unknown.
Improvement
Improvement relates to the processes of reviewing and improving the approach and its deployment.
Considering the Improvement dimension leads to an examination of:
the process by which the appropriateness and effectiveness of the approach and its deployment are reviewed
how these reviews have led to improvement
how the lessons learned are captured and shared.
Improvement is a management responsibility. Continuing the school curriculum example, a school’s senior leaders are expected to regularly review and refine the school’s curriculum. This assessment dimension examines the process by which that is undertaken, the improvements that have resulted and how these improvements are documented and shared with staff and other key stakeholders.
Why ADRI is useful
The assessment dimensions are useful for two purposes: diagnosis and design.
Diagnosis
When something is not working well in an organisation, ADRI provides a lens for examining activities and results to determine why it isn’t working and then to determine what to do about it.
When things aren’t going well, it could be because:
the Approach is weak
the Deployment is poor.
If the approach is weak, attention must be paid to reviewing and improving the design. Deploying a poor approach will not deliver good results.
A sound approach, poorly deployed, will not deliver good results either. If the approach is well thought through but is not being applied, then attention needs to be paid to ensuring people know about and implement the agreed approach.
Note that these two causes – a weak approach and poor deployment – have the same effect: disappointing results. Yet the actions required to address the disappointing results are quite different. ADRI can assist in determining which cause is more significant.
For example, a school may identify parent dissatisfaction with student reports. Firstly, knowledge of ADRI would lead the school leadership team to seek clarity and reflect upon the school’s design for assessment and reporting. Which assessments are to be undertaken? What is the schedule? What is the agreed process for reporting? Is the approach appropriate? These are questions regarding the approach. Secondly, they would explore the extent to which the approach is being applied in practice. Do staff understand and follow the agreed procedures? Are timelines being met? These are questions regarding deployment. Actions required to address parent dissatisfaction will be quite different depending where the opportunities for improvement lie: in the approach, or more to do with deployment.
Design
ADRI is also useful when designing organisation’s systems, structures and processes. In thinking about how to pursue any area of endeavour, ADRI provides useful guidance to ensure key considerations are not overlooked. If you look back over the considerations associated with each of the dimensions, you can easily identify key questions to be answered when determining how to design processes that will achieve an organisation’s goals. These questions could include:
Have we clearly articulated our purpose, desired outcomes and a vision of excellence?
What are the needs of our clients and key stakeholders?
What strategies, structures and processes are required to achieve our aspirations?
What data do we need to measure effectiveness and track progress over time? How will these data be collected, collated and regularly reported?
How will we document, train and coach people to adopt the new approach?
How will we monitor the acceptance and application of the new approach?
How will ongoing performance data be monitored and evaluated?
What is the cycle of review and improvement for this approach and its deployment?
How to use ADRI
The assessment dimensions of ADRI can be used in many ways. Typically, they are used as:
a checklist for reflecting upon the activities and results of an organisation
a framework for describing the activities and results of an organisation
an assessment model to evaluate the activities and results of an organisation.
ADRI is commonly used as a checklist to think about what is happening in an organisation. For example, thinking about whether observed difficulties are due to a deficient approach or poor deployment is a common application.
ADRI can provide a structure for describing how an organisation goes about its business. This use of ADRI is common in performance excellence awards processes such as those based on the Australian Business Excellence Awards, the Malcolm Baldrige National Quality Awards in the USA, and those of the European Foundation for Quality Management. Organisations describe explicitly how they go about each assessment dimension for each area of endeavour. The areas described are usually the categories or items of these specific frameworks (for example, Leadership, Strategy and Planning, Customers and Other Stakeholders). The use of ADRI in this way is applicable to any area of organisational activity.
A school (or district) could use ADRI as a structure to describe any program, initiative, project or other area of endeavour. For example; a district could document its thinking and planning (approach) to community engagement, how that has been implemented across the district (deployment), how data demonstrate effectiveness in community engagement (results), and the process by which the district reviews and improves community engagement (improvement). The act of documenting the activities and results in this structure usually leads to the identification of strengths and areas of opportunity for improvement.
ADRI can also be used to evaluate or rate the organisation’s activities and results. The figureabove, ADRI Review Process Poster for Self-assessment, which you can download free of charge from our website, provides a structure for such an evaluation. Each of the four dimensions, ADRI, is evaluated and given a rating, which leads to identification of strengths and opportunities for improvement.
How does ADRI relate to PDSA?
The Plan-Do-Study-Act (PDSA) cycle, provides a step-by-step process to bring about improvement over time. ADRI provides specific dimensions to reflect upon the activities and results of an organisation at a specific point in time.
Both PDSA and ADRI are based on the learning and improvement cycle, also known as scientific method and action research. PDSA provides a method for realising improvement. ADRI provides a structure for identifying where improvement may be required.
At its simplest level, a shared vision is the answer to the question, “What do we want to create?” Peter Senge, 1990, The Fifth Discipline, p206.
A shared vision is a mutual agreement as to the desired future state key stakeholders are working together to create. It helps to align effort, optimise contribution, and to maximise organisational performance and improvement.
Many organisation improvement models recognise the importance of establishing a shared vision. The National School Improvement Tool (ACER 2012) describes the need for; ‘an explicit improvement agenda’. The Australia Business Excellence Framework (SAI Global 2011) defines an excellent organisation as one that; ‘defines its purpose, vision and values for organisational success and ensures it is understood and applied across the organisation’.
How to create shared vision
So, if stakeholder commitment to a shared vision of excellence is critical to organisational wellbeing, how do we make it happen?
Christie Downs Primary School in South Australia has done so – to great effect! The school, of 270 students, includes 90 learners with special needs supported by an integrated Disability Unit. The current school was established four years ago through the merging of two sites, an existing primary and special school. Two different cultures and organisations needed to come together to work as one. The school engaged key stakeholders in creating a shared school vision. The vision would also inform the new school’s four-year strategic plan.
Every student and staff member took part in at least one of a series of workshops to provide their ideas. Parents, families and other community members were invited to attend either a student or after hours workshop to have their say. Students with special needs were interviewed using creative one-on-one techniques that gave them a ‘voice’. Stakeholder input was then collated and a vision drafted by a team comprising students, parents and staff. Students were allowed to lead the team to ensure the crafting of a simple, jargon-free, to-the-point guiding statement. The resulting draft was communicated to all stakeholders, agreed, and used to inform the school strategic plan.
The vision has guided improvement activity and decision-making across the school for the last four years. Leadership and staff attribute the positive culture the school enjoys today to the ownership and commitment generated through this visioning process.
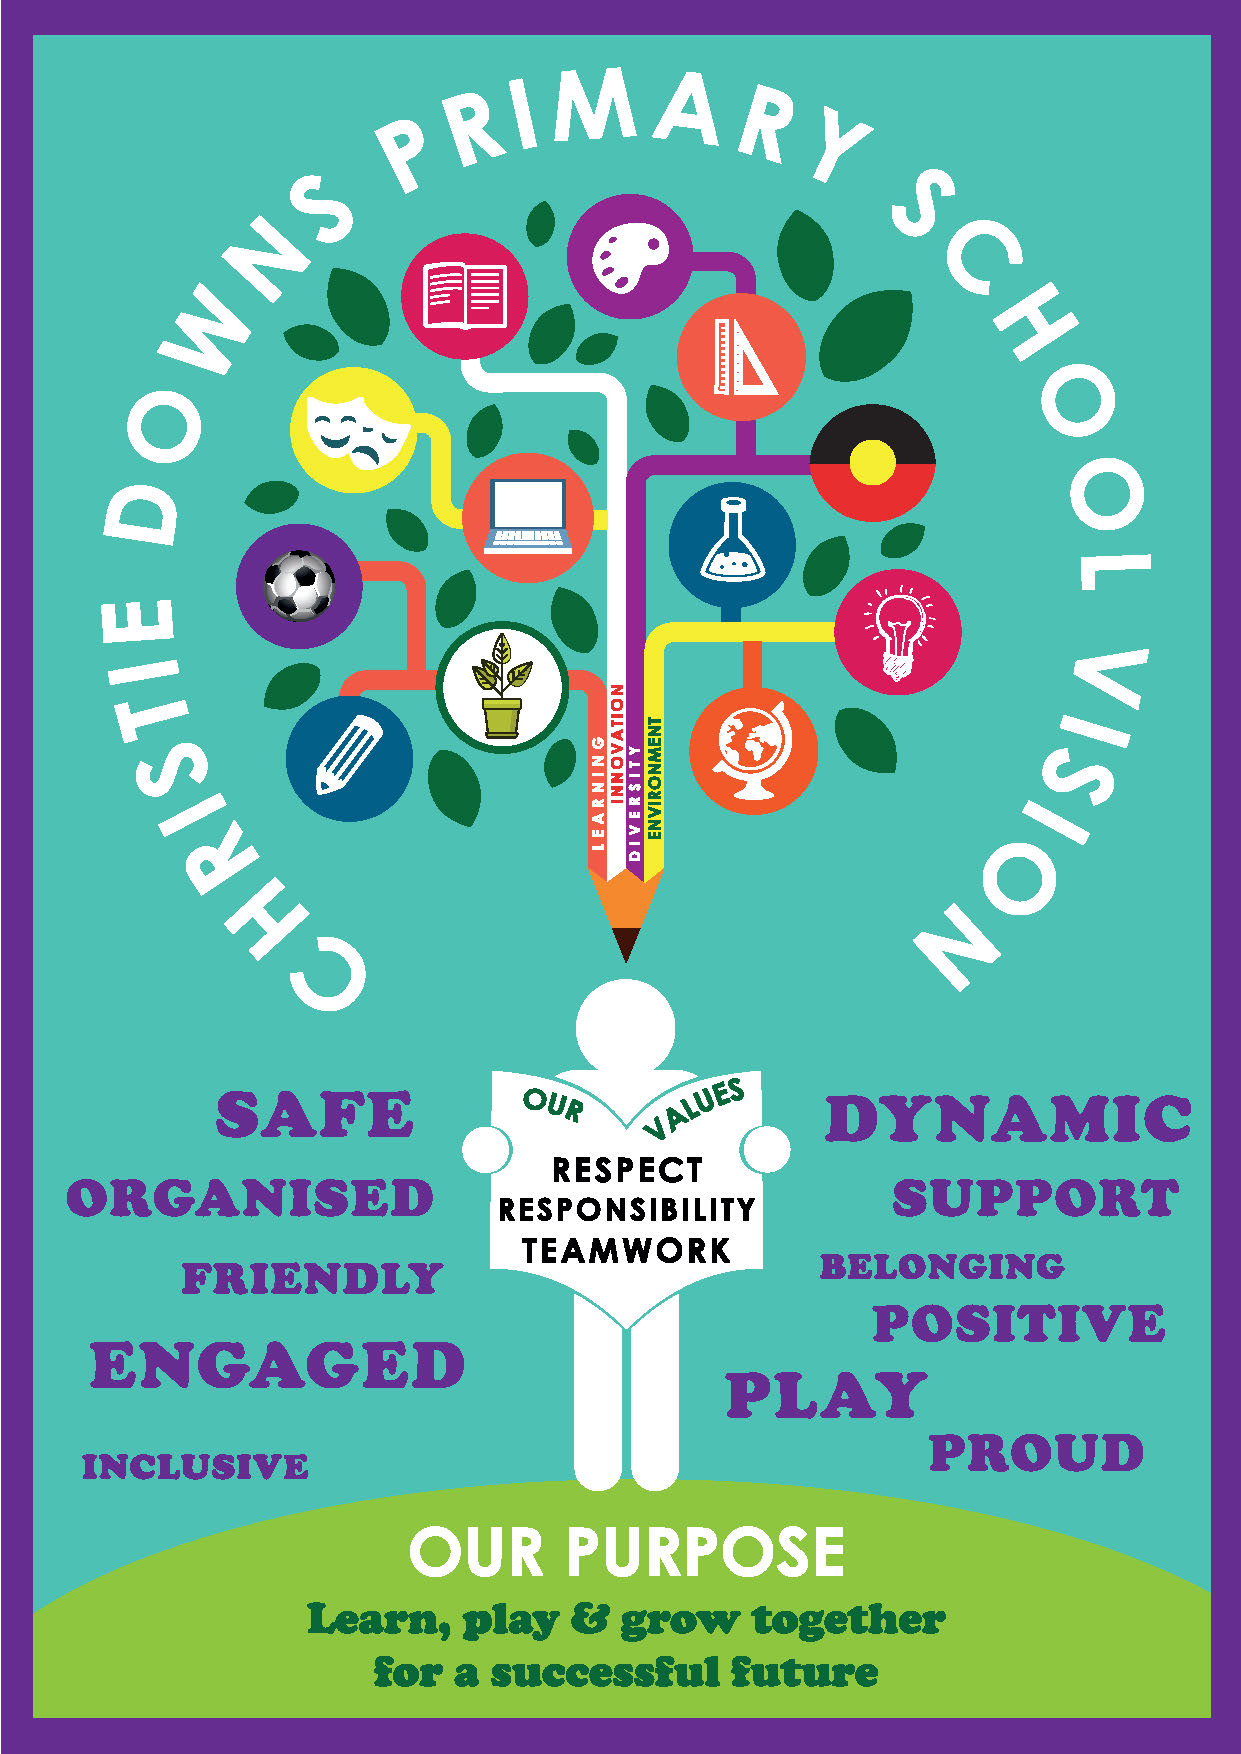
Earlier this year, the fourth in the school’s planning cycle, stakeholders were invited to reflect on achievements and again have input to the school vision to inform the next strategic plan. A refined school purpose, values and behaviours, and graduate profile were also agreed. The process was very similar to that used four years previously with all students, staff and families inputting their ideas. However, this time the school team (again comprising students, parents and staff) chose to summarise and communicate the revised school direction by way of an image: that of a tree (pictured below).
Christie Downs Primary School Vision
All stakeholders are really excited about their tree metaphor! The tree roots are the school’s purpose. The supporting trunk of the tree are the key elements of the school vision – ‘learning, innovation, diversity, and environment’, these underpin the strategies of the school plan. The values of the school are in the hands of the stakeholder who stands beneath the tree branches and leaves – the graduate profile – the skills and capacities, attitudes and behaviours developed by the students of the school.
Congratulations Christie Downs!
So what is different about this approach?
This collaborative process:
involves all key stakeholders of the school community – everyone has a ‘voice’
celebrates diversity, allowing for a richness of ideas to flourish (this is not possible when only a few in the organisation are involved)
builds shared understanding, ownership and commitment.