Tag Archives: Quality Learning tools

A Correlation Chart

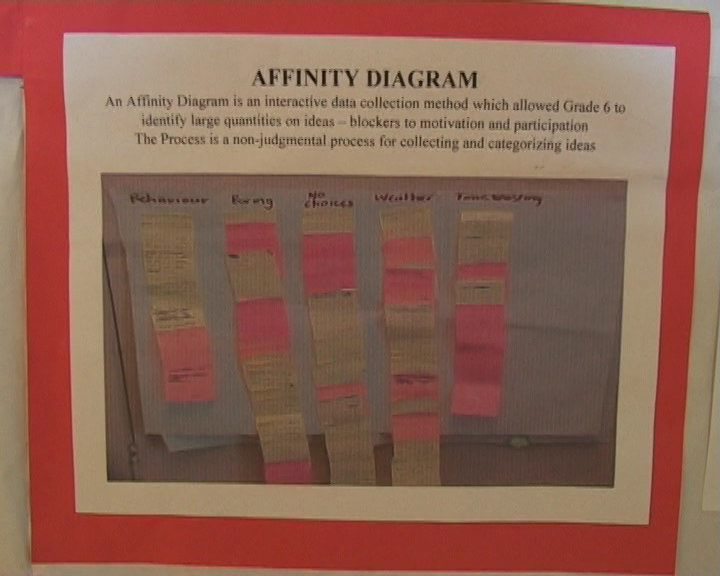
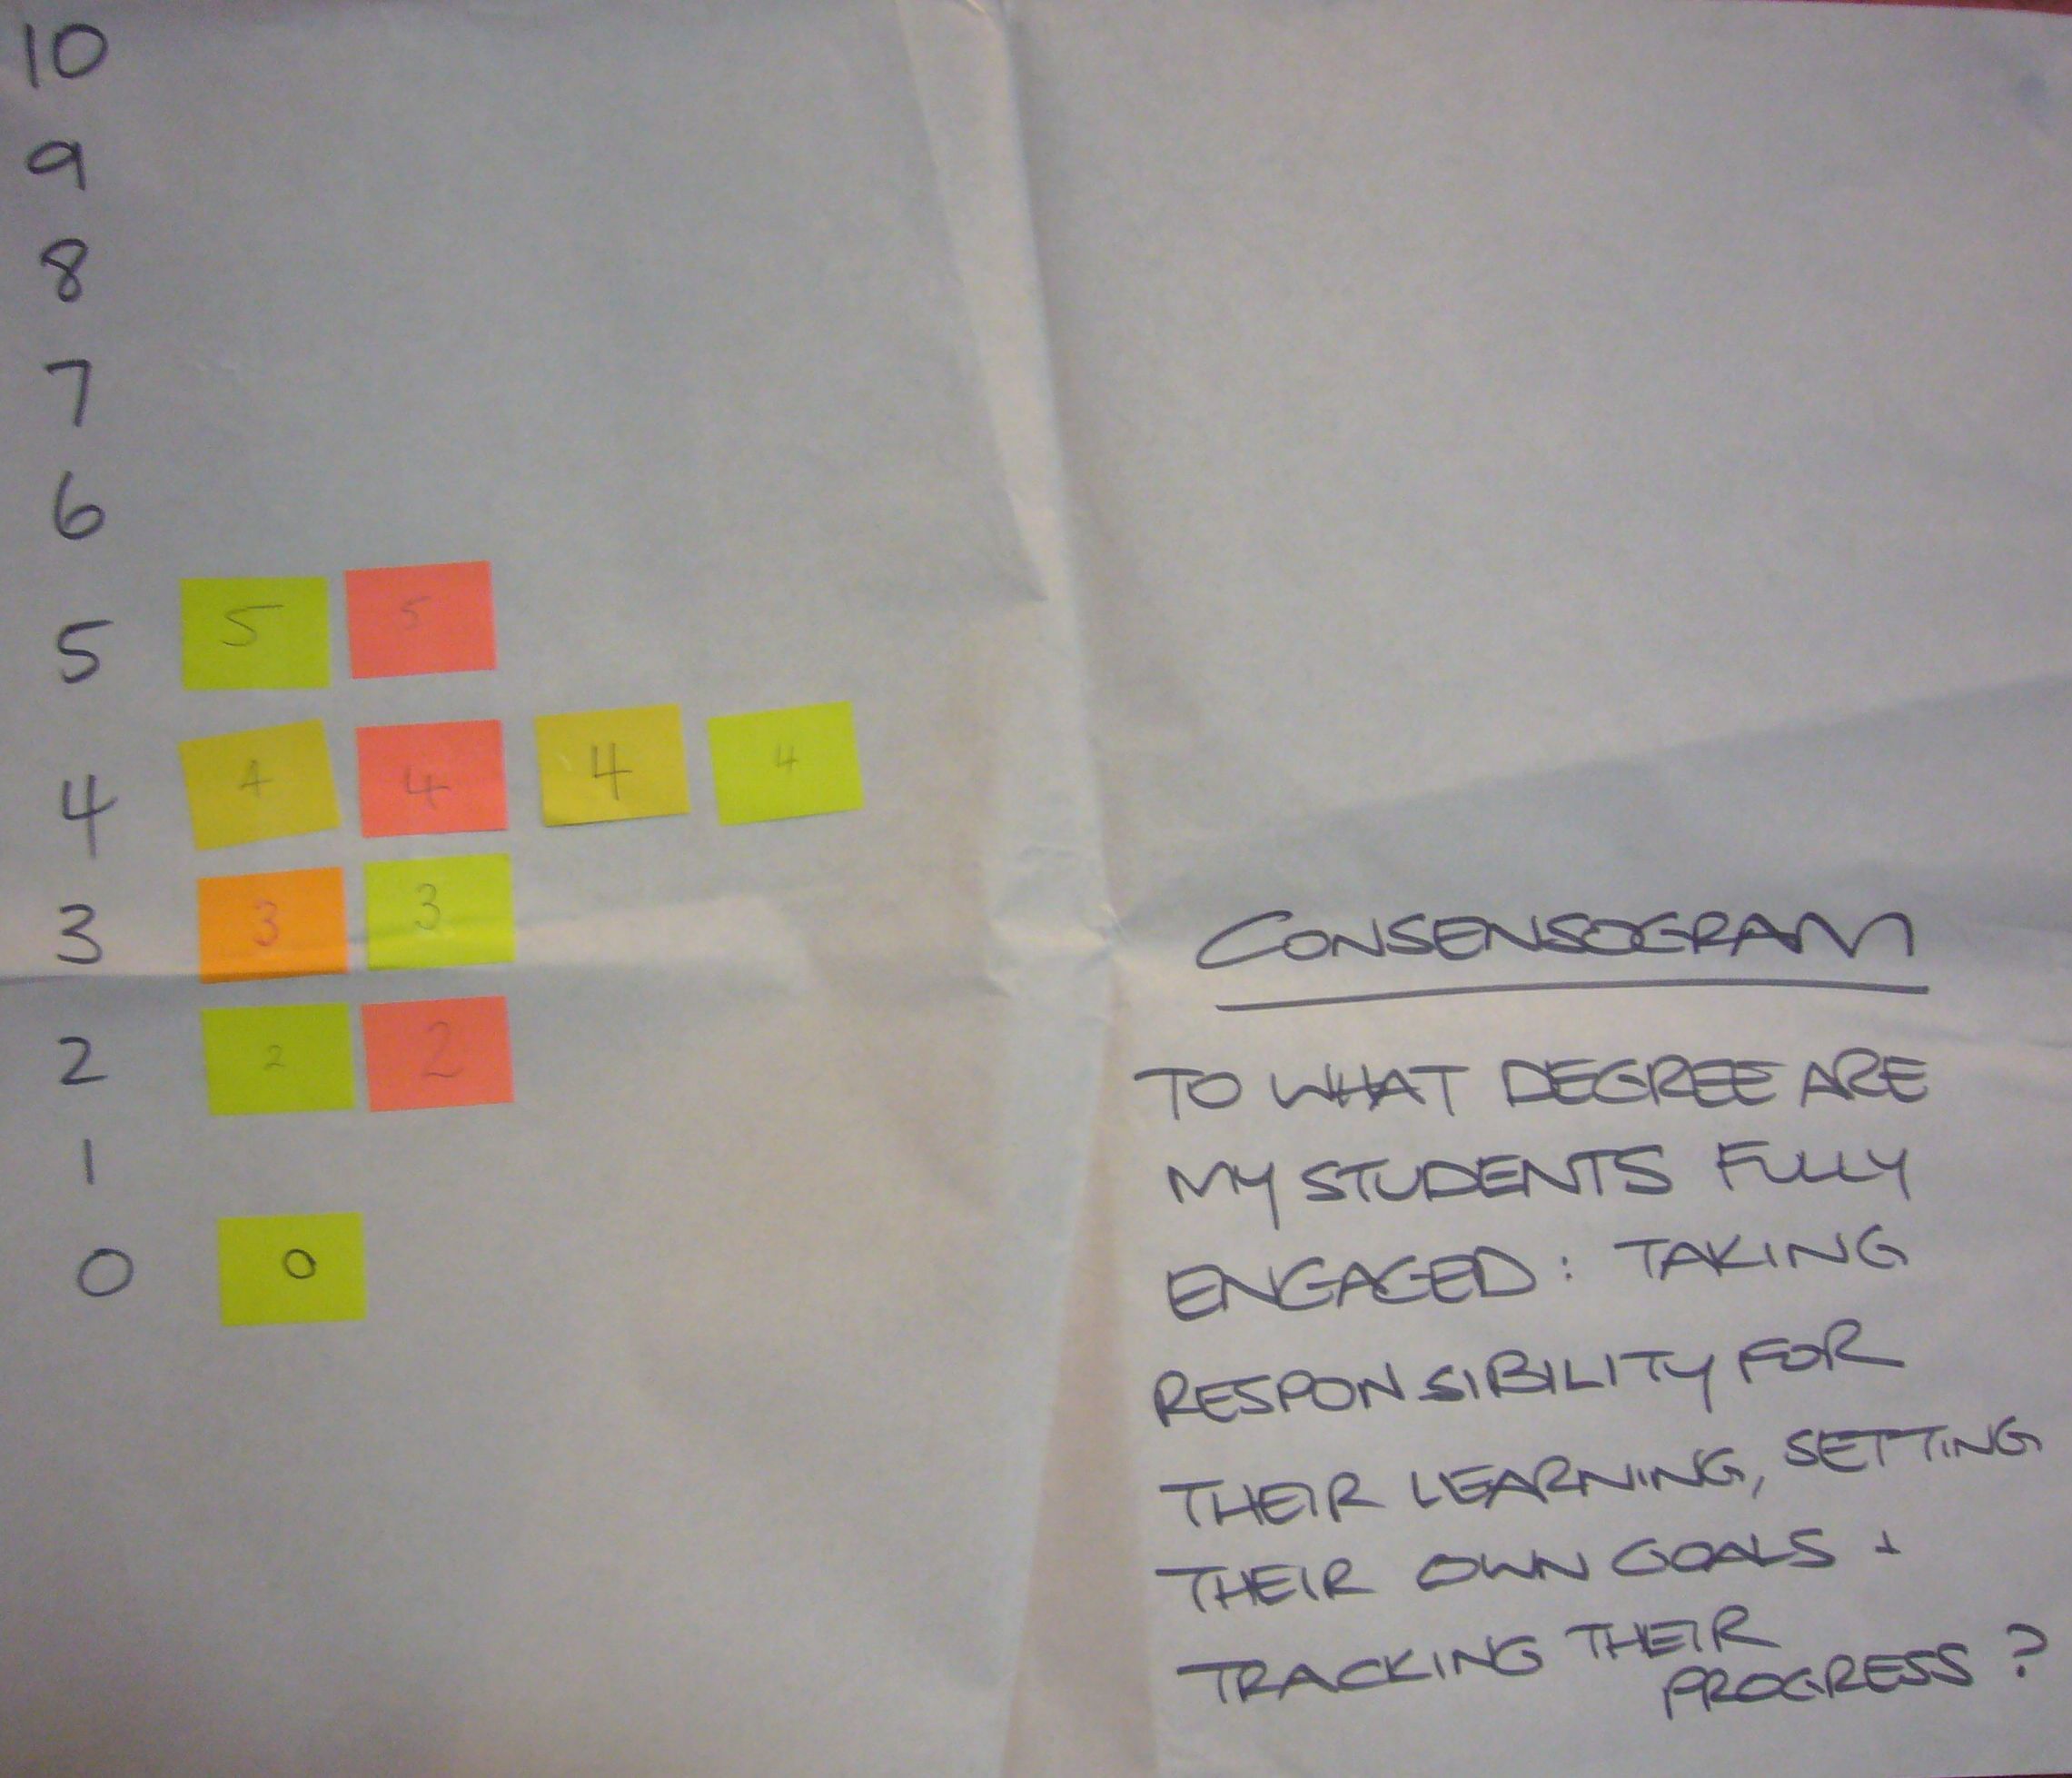
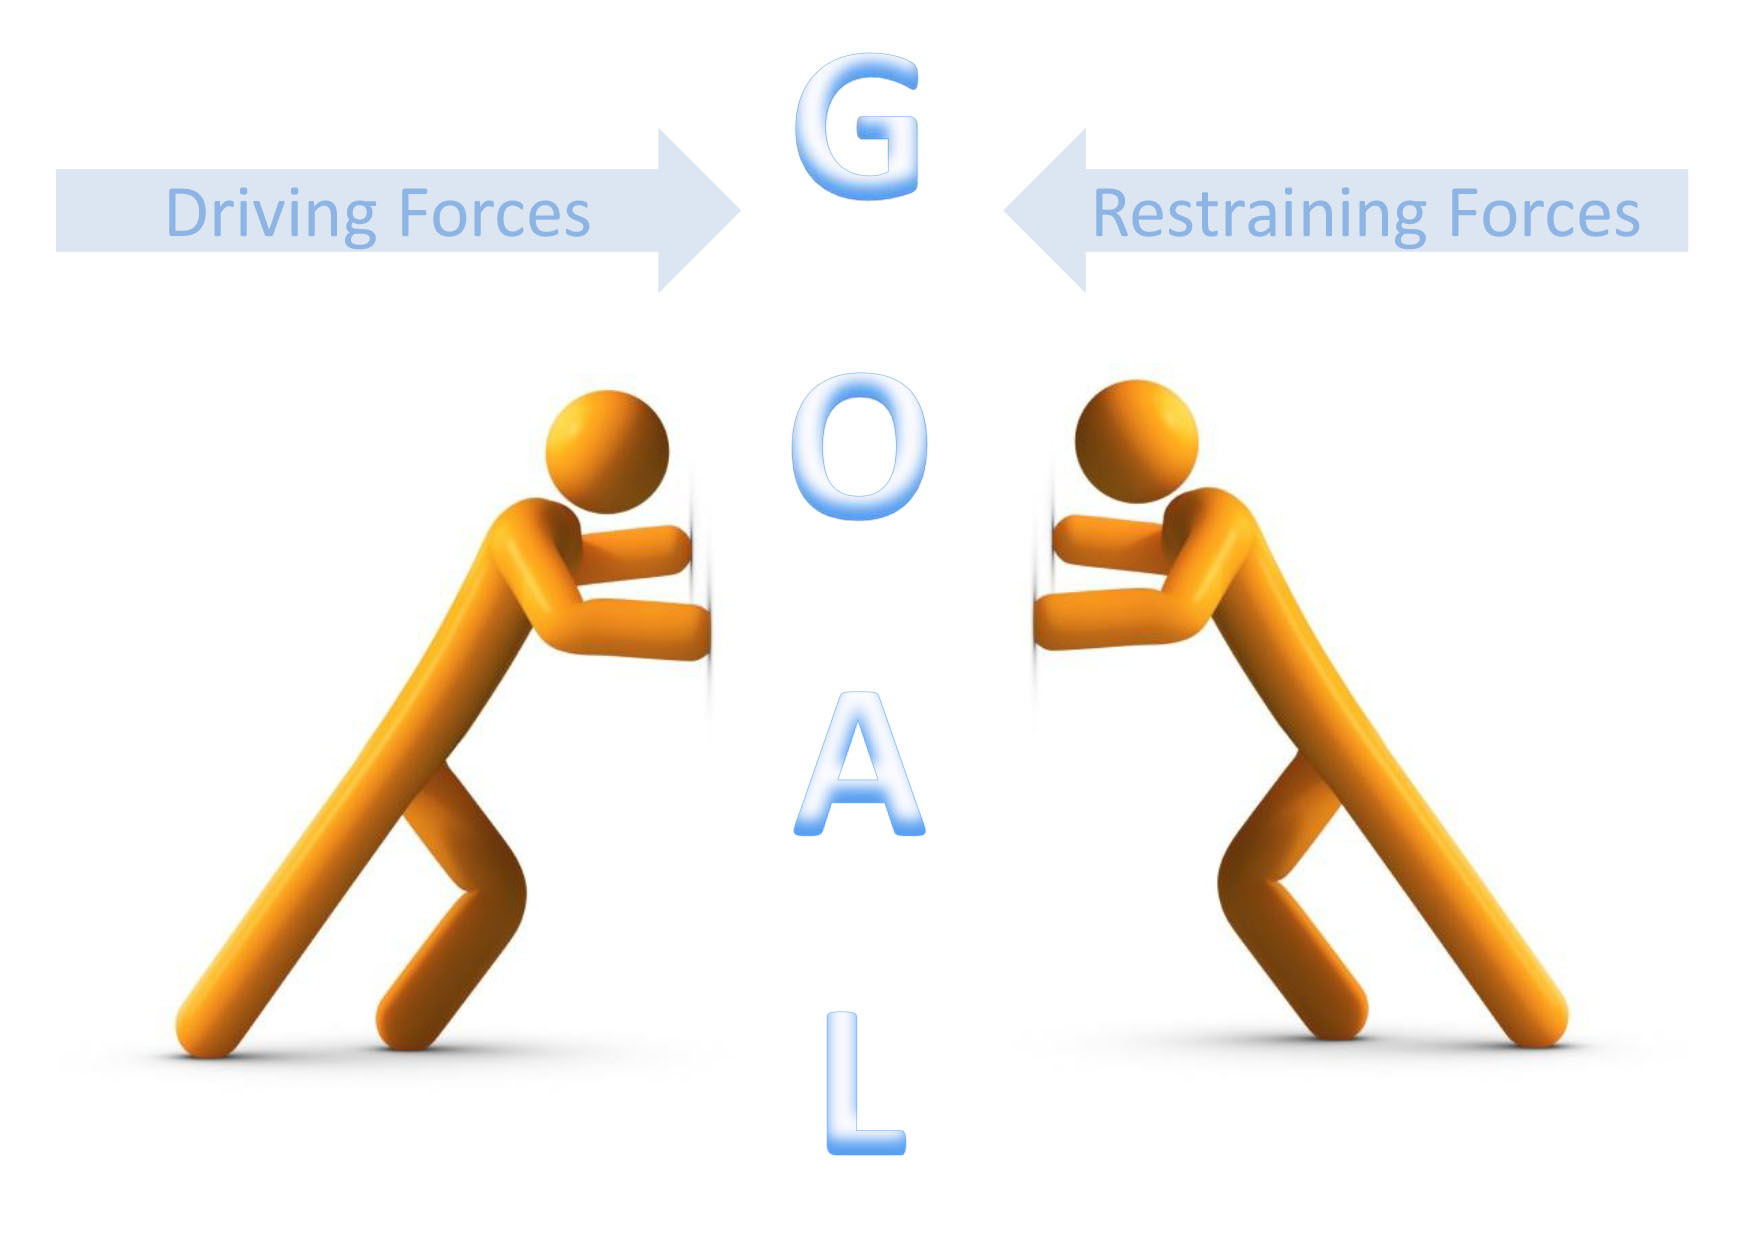
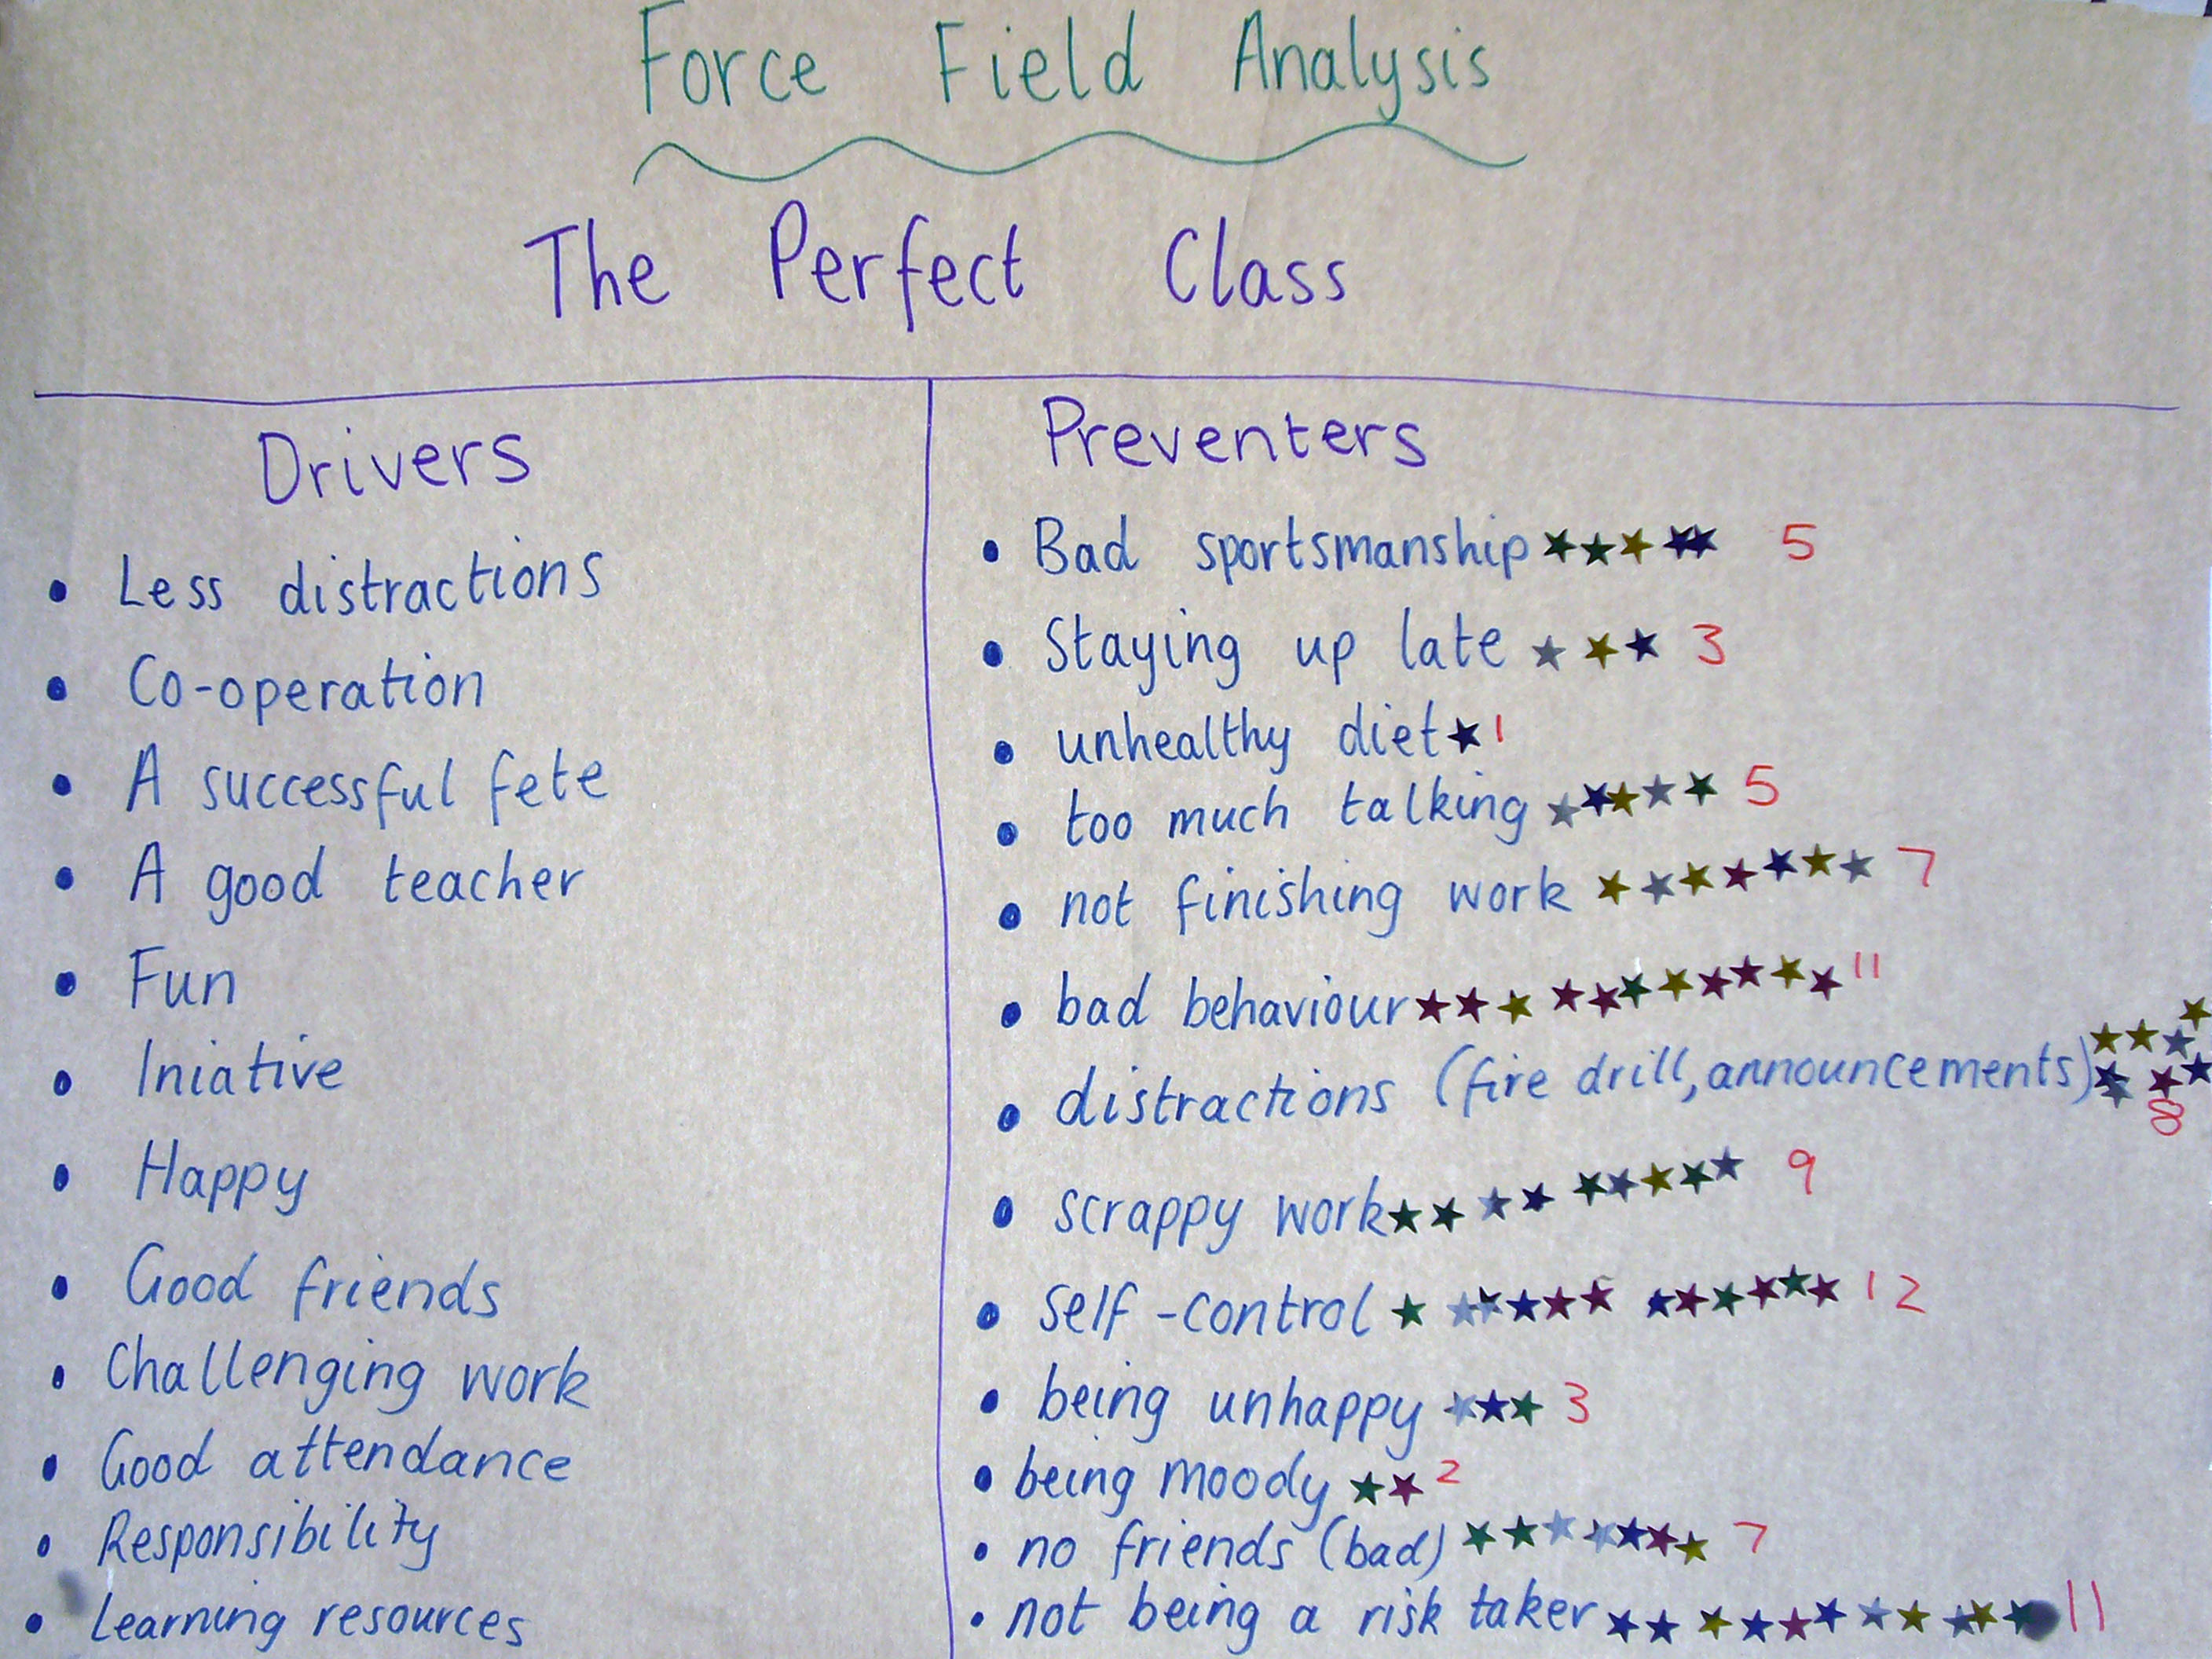
There are many Quality Learning tools for gathering the perspectives of groups of people: Consensogram, Parking Lot, Affinity Diagram, Plus/Delta, Fishbone Diagram, Force-field Analysis, to name a few.

Sometimes it’s desirable to gather views on more than one issue, and to examine the relationship between responses to these issues.

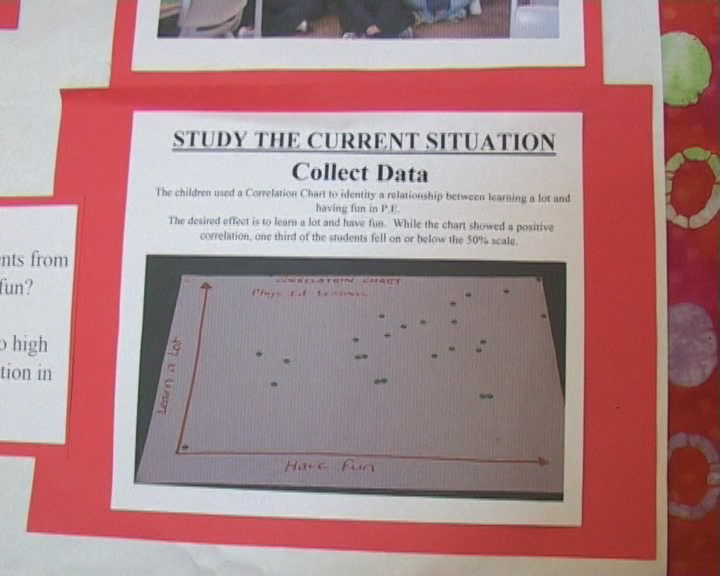
A Correlation Chart is useful for examining the relationship between responses.

Correlation Chart

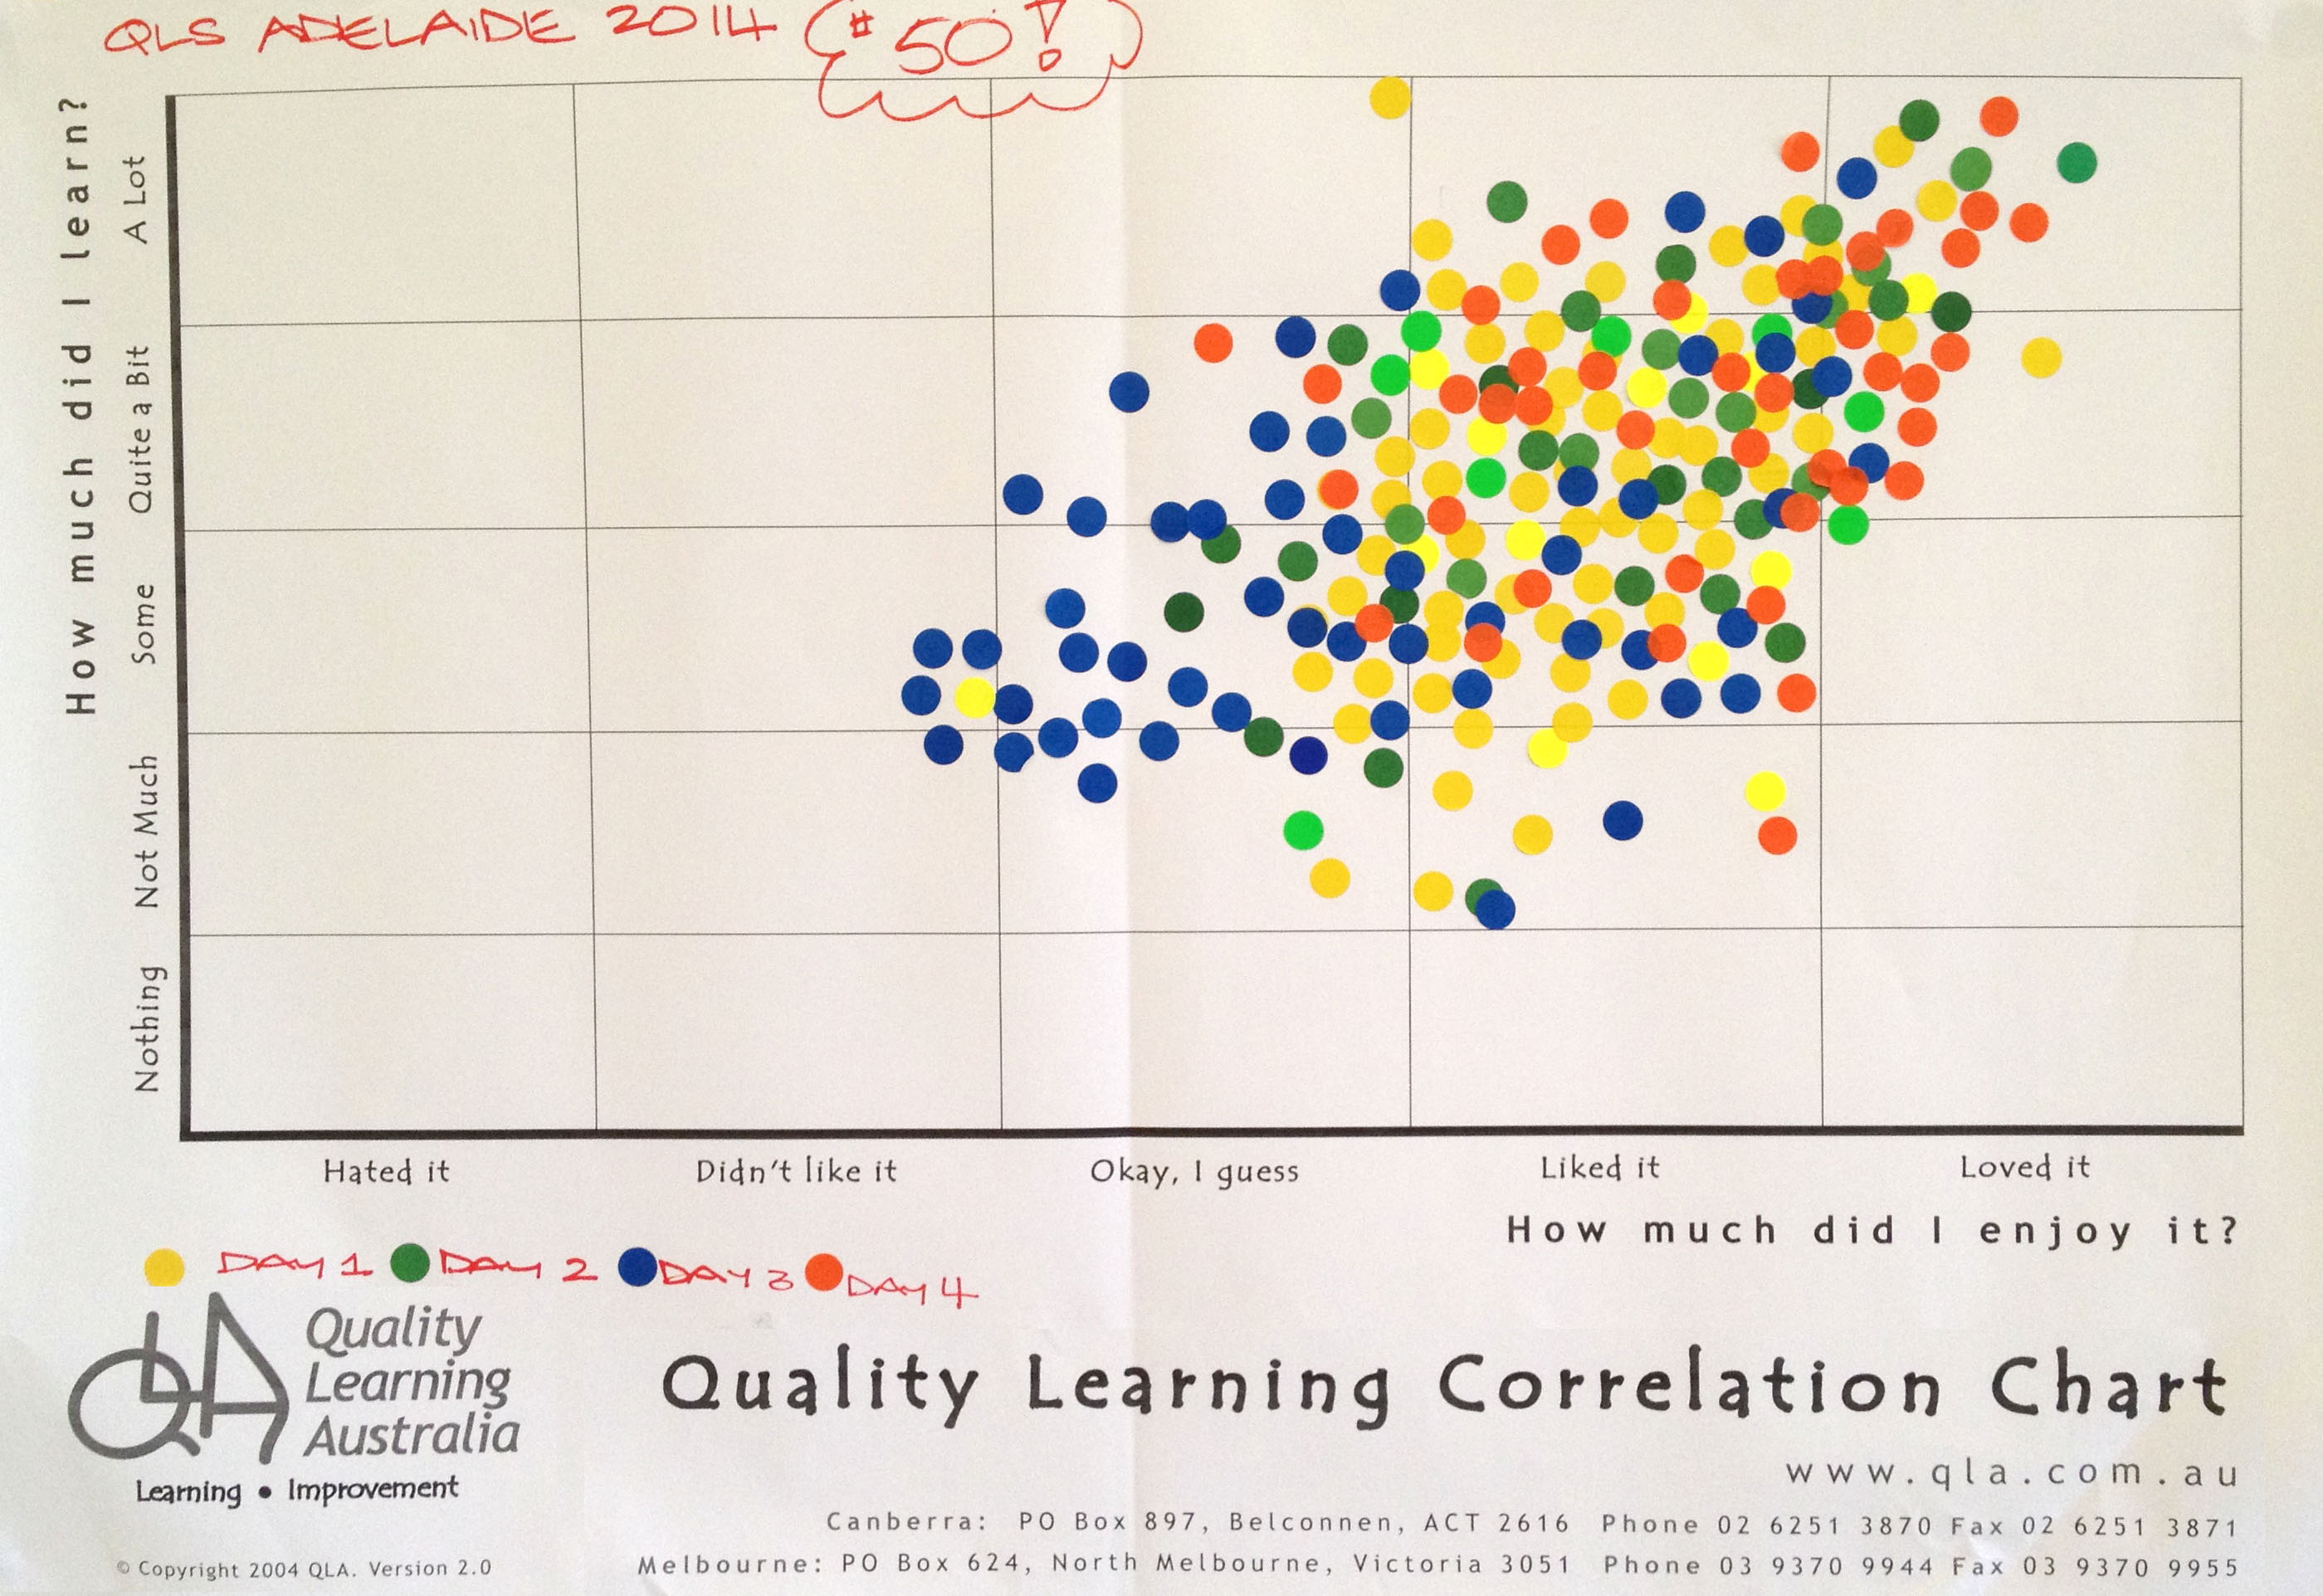
We regularly use a Correlation Chart as a quick and effective way to gather feedback from participants in our workshops. Figure 1 shows a Correlation Chart from a workshop – the 50th four-day Quality Learning Seminar with David Langford held in Australia.

Workshop participant feedback on a Correlation Chart
Figure 1. Workshop participant feedback on a Correlation Chart

Many teachers use a Correlation Chart at the end of a unit of work to gather student feedback on the unit.

Set the questions and scale

The first step when using a Correlation Chart is to decide the questions. The most common question are those shown in Figure 1, namely:

  • How much did you enjoy the workshop/course/unit of work?
  • How much did you learn?

The questions must lend themselves to a scaled response.

Binary questions, which have only two responses such as yes or no, don’t work for a Correlation Chart.

Scales we have seen used effectively include:

  • Frequency: rarely to nearly always
  • Importance: not important to critical
  • Performance: very poor to excellent
  • Amount: nothing to a lot
  • Disposition: hate it to love it
  • Knowledge: never heard of it to mastered it
  • Confidence: not confident to supremely confident.

Whichever scale you choose, respondents will find it helpful if you define ‘anchor points’ along the scale. We typically define five such points. For example, for Frequency:

  • Rarely (10%)
  • Sometimes (25%)
  • Moderately (50%)
  • Mostly (75%)
  • Nearly Always (90%)

Gather and display the data

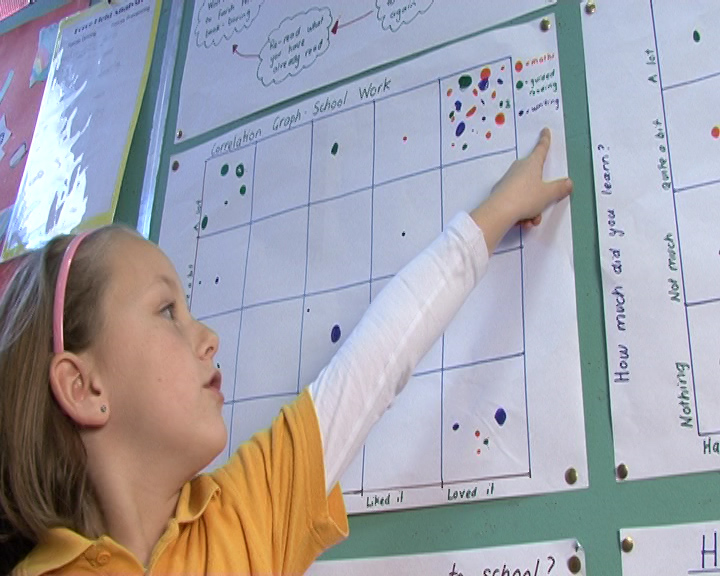
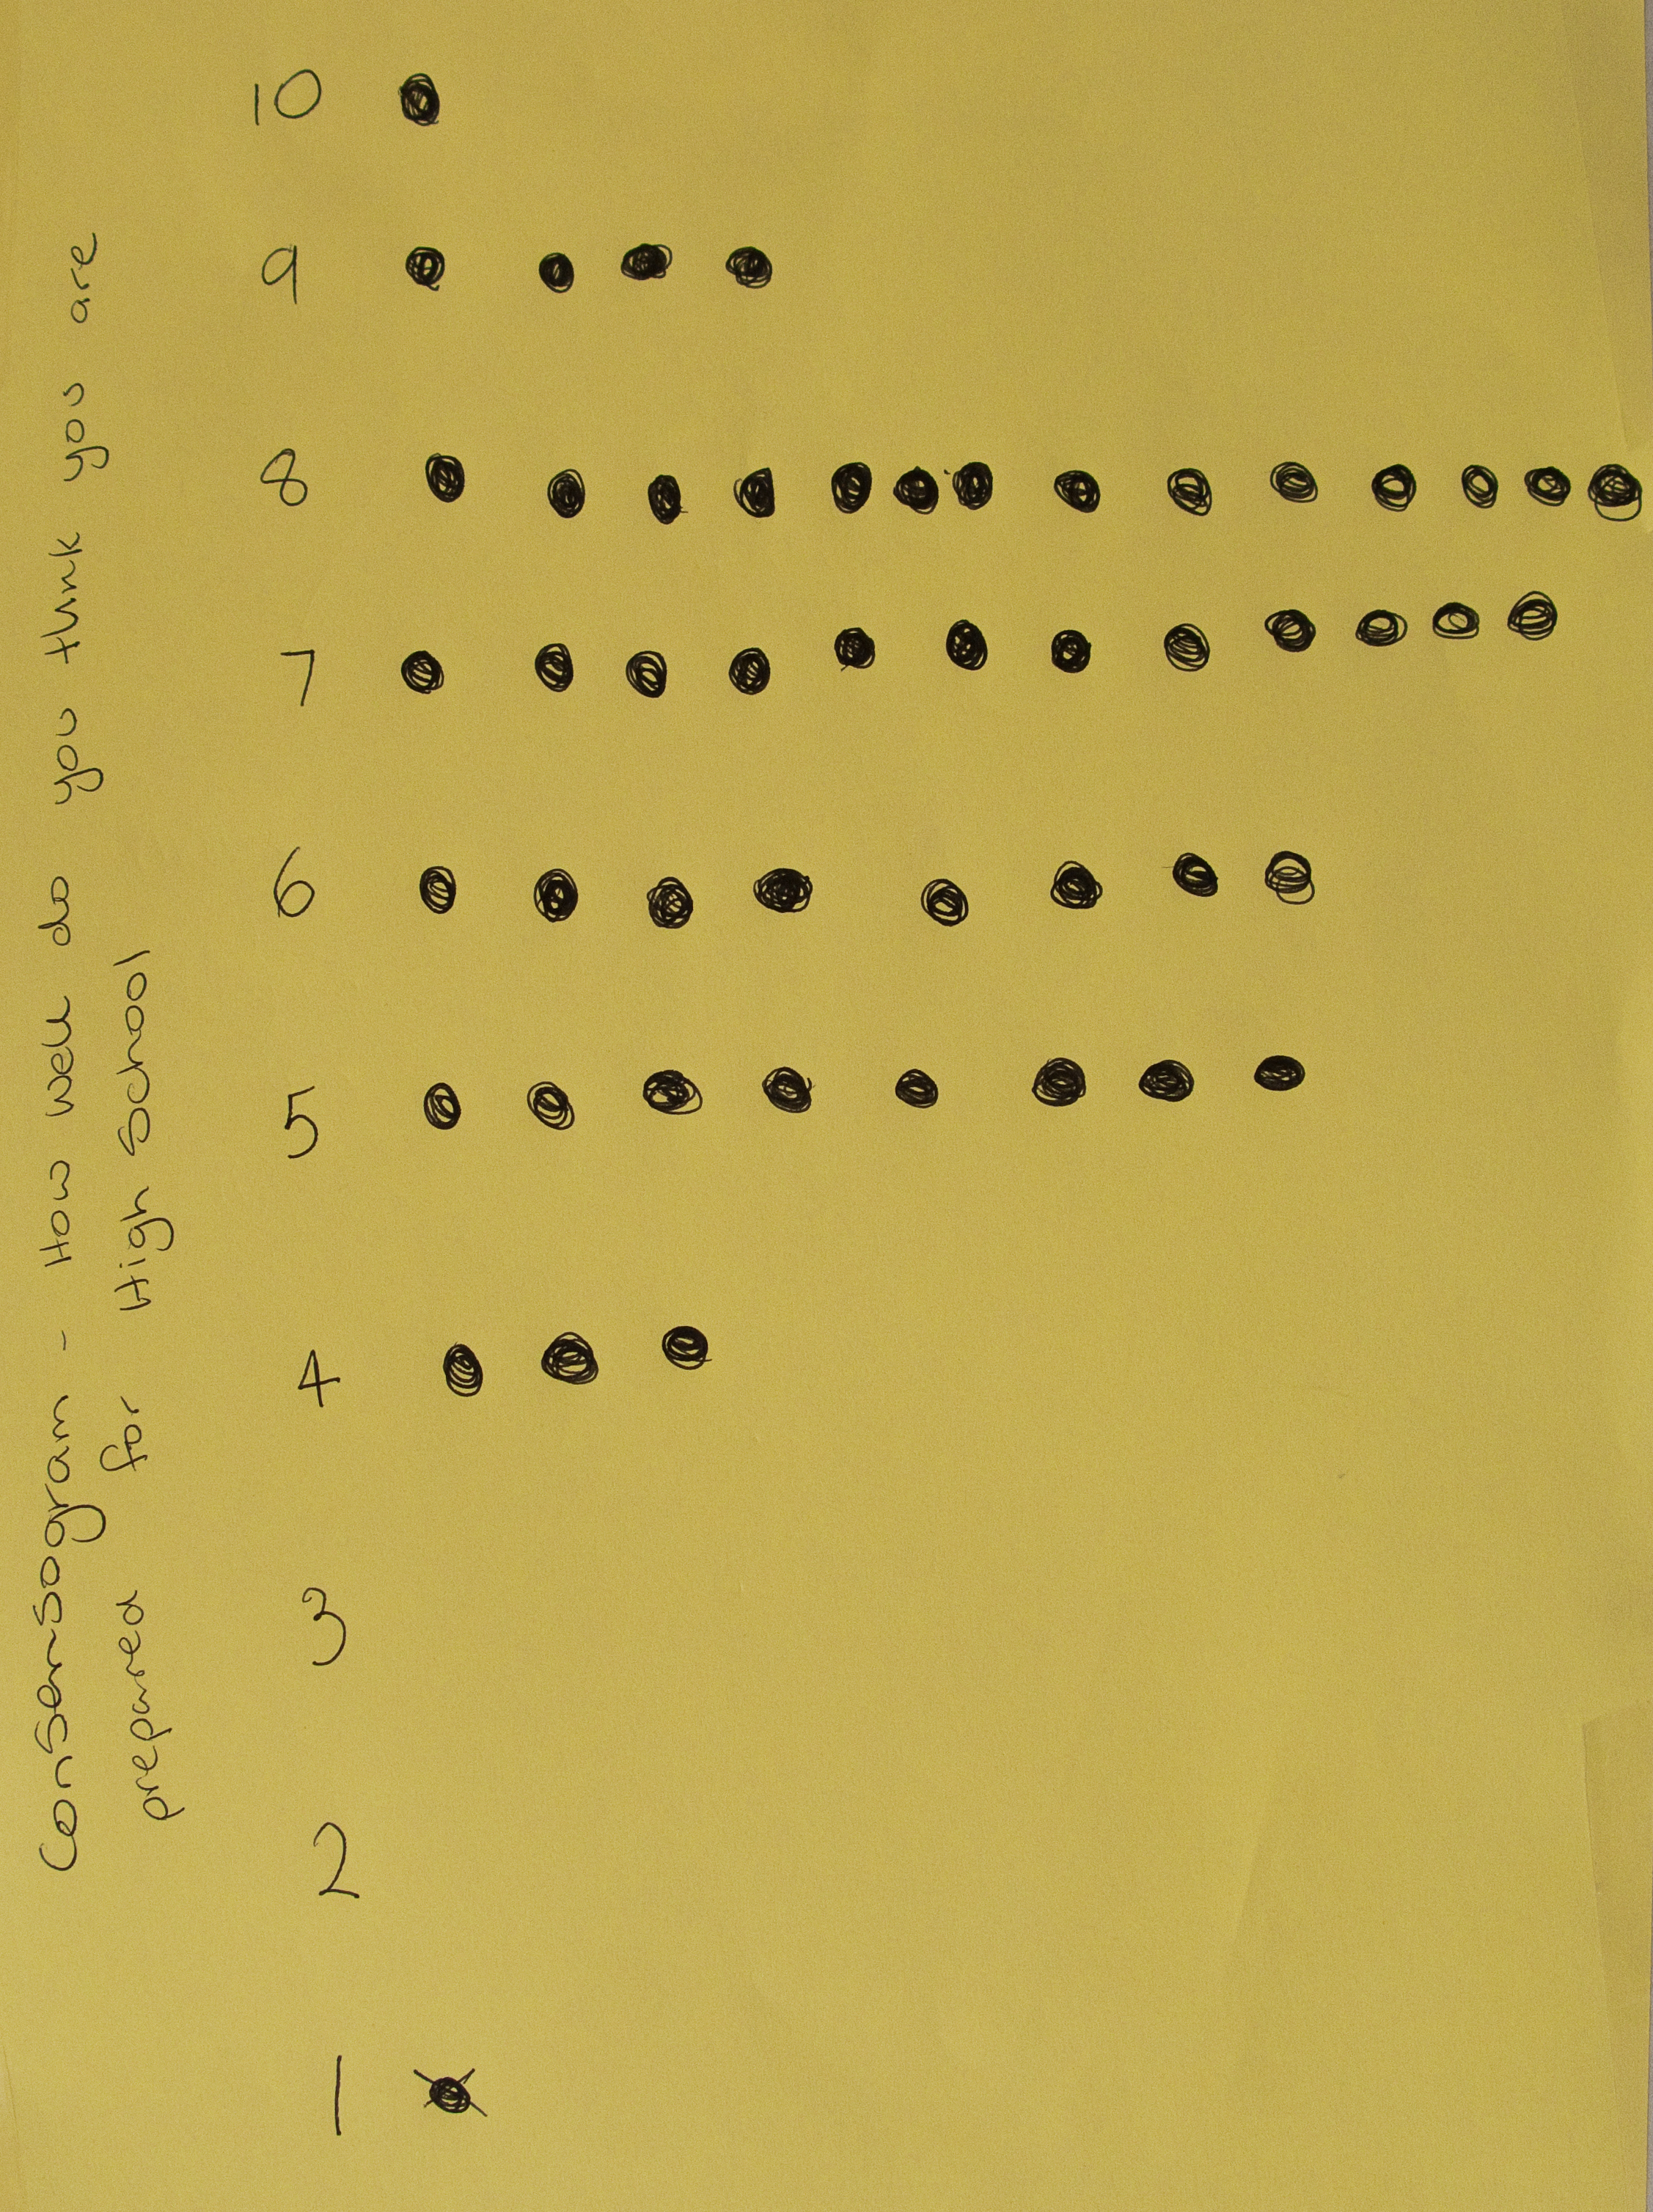
Having determined the questions and scale, the next step is to draw up the correlation chart. It doesn’t have to be typed and printed; hand written charts, such as that shown in Figure 2 work quite well.

A hand-written Correlation Chart
Figure 2. A hand-written Correlation Chart

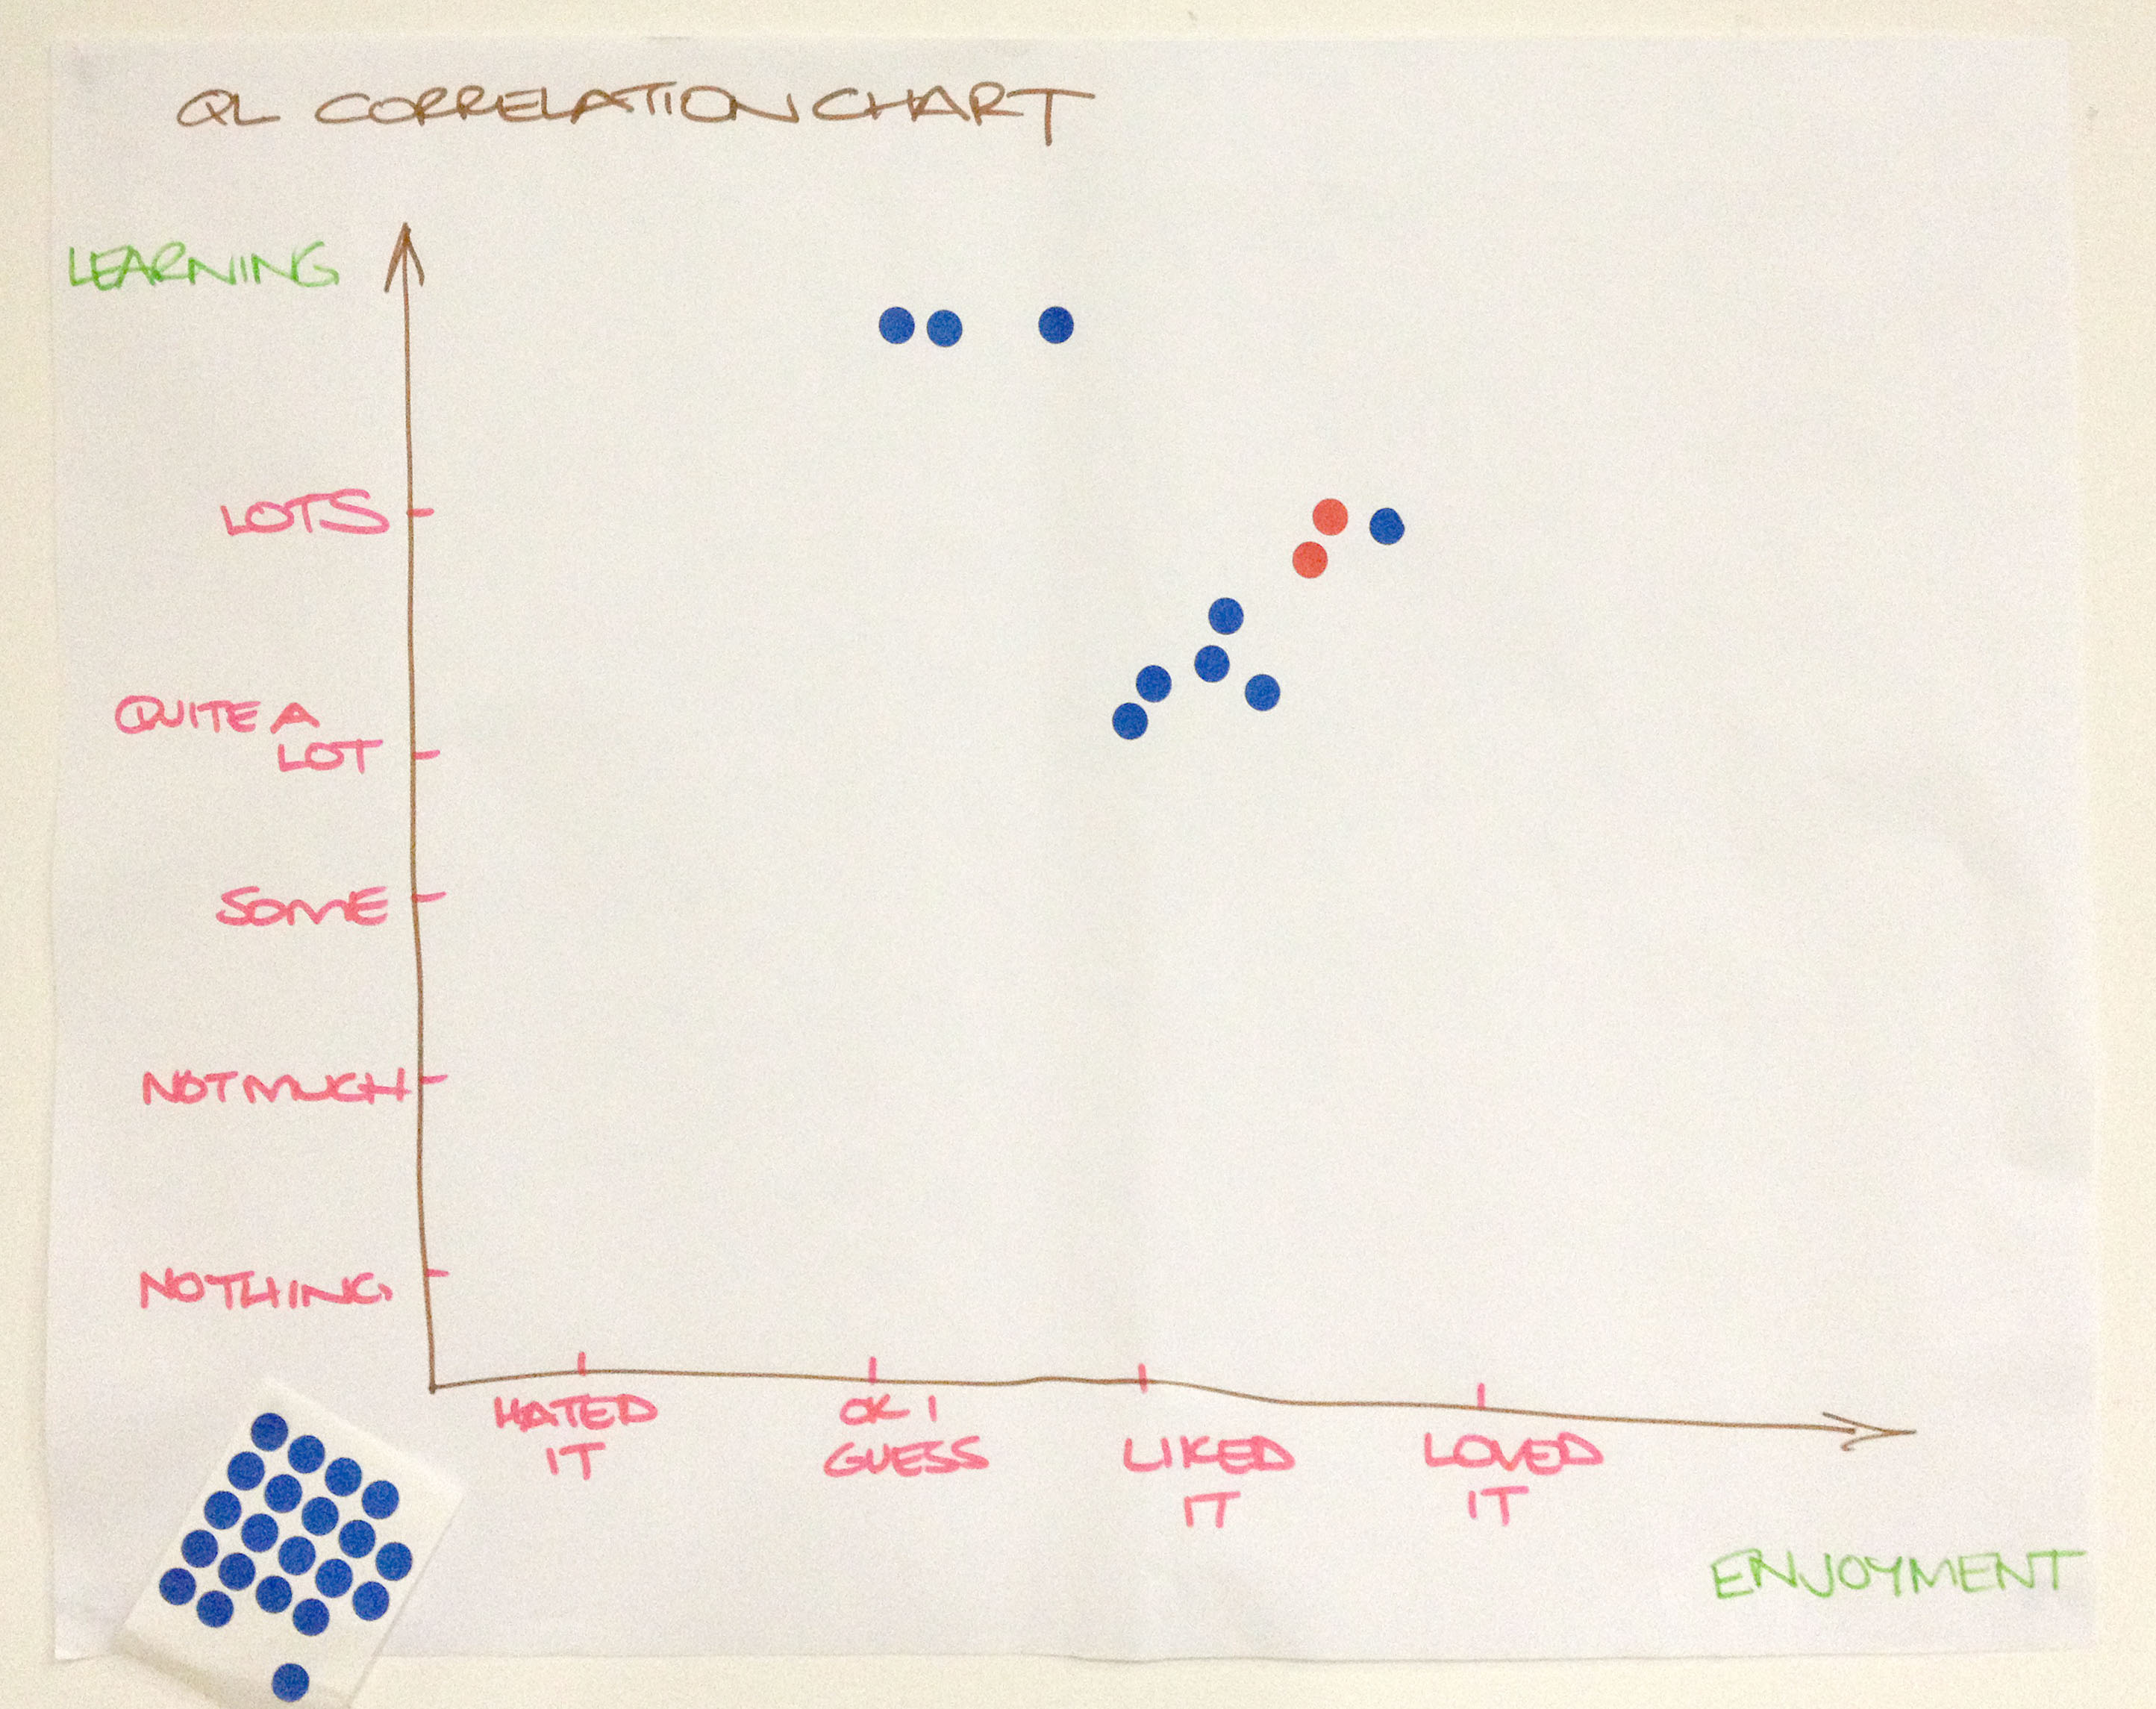
Provide a sheet of adhesive dots (or a marker pen). Invite respondents to place a dot in the chart in response to the two questions.

Consider the relationship

What patterns can you see in the data? In Figure 1, you will notice the tendency for individuals’ ratings of learning and enjoyment to be quite similar. Those who reported they enjoyed the seminar more tended to report learning more. In other words, there is a positive correlation between these variables.

Remember, correlation does not mean causation. Correlation only indicates a relationship exists, it doesn’t explain the nature of the relationship. In Australia, for instance, there is a correlation between sales of ice cream cones and shark attacks; nobody suggests one causes the other.

Decide what to do next

Data inform decisions. We collect data to help us decide what to do next. Be sure to consider what the data are suggesting you need to do.

Benefits of a Correlation Chart

A Correlation Chart is easy to use. It can easily be made during a staff or class meeting, with the results instantly visible for everyone to see. It is much easier than a survey!

Everyone can see their own dots on a Correlation Chart; they know their voice is heard and that their opinion matters.

Like many of the Quality Learning tools, a Correlation Chart gives voice to the silent majority while giving perspective to the vocal minority. People see how their perspective relates to those of others in the group.

Keep in mind

A Correlation Chart does not provide any information regarding the reasons for the responses. Take care not to attribute reasons without further investigation.

Respect the anonymity of the respondents. If there are outlier responses – special causes – that are clearly different to those of the majority, don’t seek to identify the individuals concerned. Rather, invite the individual(s) to have a quiet word with you later so you can understand their perspective. There is frequently richness in the views of outliers.


Read more about the Quality Learning Tools.

Learn more about the Quality Learning approach from our book Improving Learning: A how-to guide for school improvement.

Purchase David Langford’s Tool Time for Education book, which explains dozens of tools and how to use them.


Quality Learning Tools

Tools to improve the quality of learning

Educators can get very excited by Quality Learning tools. In this post we explore these tools and how to use them most effectively.

Students from Hallett Cove R-12 School in South Australia complete an Inter-relationship Digraph
Students from Hallett Cove R-12 School in South Australia complete an Inter-relationship Digraph.

What is a Quality Learning tool?

Let’s start with a definition of any tool.

A tool is a physical or procedural instrument.

A hammer is a tool, a physical instrument for driving nails. A to-do list is a tool, a procedural instrument for helping us remember what we have to get done. The internet is a tool that requires both a physical instrument (computer or smart phone) and procedures to follow to connect and gain access to information.

A Quality Learning tool is a physical or procedural instrument used to improve the quality of learning.

The Quality Learning tools have their origins in quality improvement tools, first introduced in Japan in the 1960s. These early tools, such as the check sheet, fishbone diagram and Pareto chart, were used to gather and display data with a view to improving the quality of products and services. Management tools, such as the affinity diagram, interrelationship digraph and prioritisation matrix, were developed from the 1970s.

Over the past fifty years, additional tools have been developed in the fields of management, planning, statistical analysis, design, inter-personal collaboration, creativity and thinking.

Quality Learning tools are drawn from all of these areas.

A junior primary student from Plenty Parklands Primary School describes the writing process
A junior primary student from Plenty Parklands Primary School steps through a flowchart of the class writing process.

Tools and new thinking

Tools are created to solve problems.

New tools usually emerge after thinking about a problem from a new or different perspective.

Consider brainstorming, for example. It is a simple tool. Everyone gets to suggest ideas that are recorded for everybody to see. Traditional brainstorming, however, has a number of weaknesses, including potential domination of the group by outspoken individuals and inconsistent levels of participation by group members. These factors frequently impact negatively on the quality of ideas generated.

To address these weaknesses, structured brainstorming was developed. Key differences between structured and traditional brainstorming are:

  1. All individuals are given time to think about the issue quietly and make a list of ideas they could contribute.
  2. Ideas are gathered progressively from each member of the group: one idea per person per turn, with the option to ‘pass’ on any turn.

Structured brainstorming was developed to solve the problems of traditional brainstorming.

The thinking that preceded the creation of the new tool or the new technique was inadequate; otherwise the tool would not have been needed. If the old thinking could have solved the problem, there would have been no need to develop a new tool to help understand the problem better or analyse it better. So the creation of the tool is usually a consequence of a shift in thinking.

Jim Duffy, 2015, Knowing & Applying: Breathing new life into service organisations, Deming Learning Network, Aberdeen, Scotland, p66

The Quality Learning tools are rooted in the thinking that underpins Quality Learning, namely what Deming called a system of profound knowledge. This philosophy can be summarised as the Principles of Quality Learning.

Tools can encourage everybody to have their say, usually in a structured manner. Everyone comes to understand the perspective of the group as a whole. In this way, they give voice to the silent majority while giving perspective to the vocal minority. 

A student from Theodore Primary School in the ACT explains a class Correlation Chart
A student from Theodore Primary School in the ACT explains a class Correlation Chart.

Examples of Quality Learning tools

The following table lists many of the most common Quality Learning tools. They are grouped by the key concepts of Systems, Knowledge, Data and variation, and Psychology and motivation. (Remembering, of course, that these concepts are more strongly interrelated than the following linear list of tools suggests.)

Systems thinking

  • Deployment Flowchart
  • Fishbone Diagram
  • Five Whys
  • Force-field Analysis
  • Imagineering
  • Interrelationship Digraph
  • Paper Passing Purpose Tool (P3T)
  • Parking Lot
  • Perception Analysis
  • Process Accountability Matrix
  • Purpose, Outcomes, Process, Evaluation (POPE)
  • SIPOC Modelling
  • Standard Flowchart
  • System Map
  • System’s Progress
  • Top-down Flowchart

Knowledge and theory

  • Bone Diagram
  • Gantt Chart
  • Hot Dot
  • Lotus Diagram
  • Operational Definition
  • Potential Improvement Matrix
  • Problem Statement

Data and variation

  • Affinity Diagram
  • Box and Whisker Plots
  • Control Chart
  • Dot Plot
  • Histogram
  • Measures Selection Matrix
  • Pareto Chart
  • Radar Chart
  • Run Chart
  • Structured Brainstorming

Psychology and motivation

  • Action and Agreement Record
  • Capacity Matrix
  • Code of Cooperation
  • Consensogram
  • Loss Function
  • Plus Delta

There is no definitive list of Quality Learning tools. New ones are being developed daily; old ones are being adapted to new situations. The list above provides a starting point; it may suggest tools you would like to go back to, or new ones you may wish to explore.

A student from Seaford 6-12 School in South Australia describes the use of a Gantt Chart to plan and track progress of an assignment
A student from Seaford 6-12 School in South Australia describes the use of a Gantt Chart to plan and track progress of an assignment.

Using the tools

As we work with schools and other organisations, one of the most common questions we are asked is: How do I know which tool to use, and when to use it?

The only way to predict whether a tool will be helpful in any given situation is to have tried the tool and learned from its application.

As you use a tool regularly, you come to know the situations in which it is most helpful and those in which it is not.

Learning about the Quality Learning philosophy can also help you apply the tools effectively, as it can deepen your understanding of the thinking behind the tools.


Read more about Quality Learning.

Study the Quality Learning philosophy, as described in our book Improving Learning: A how-to guide for school improvement.

Purchase Tool Time for Education or Tool Time for Business, comprehensive guides to the Quality Learning tools.

Watch a brief video about the use of Capacity Matrices in Primary School or High School.

Watch a brief video about the use of Flowcharts in High School or Primary School.

Watch a brief video about the use of a Gantt Chart in High School.

Five Whys – Identifying root causes and motivation

The five whys tool was developed within the Toyota Motor Corporation as a means to identify the underlying causes of problems. When root causes are identified and addressed, the problem can be fixed and stay fixed.

Five whys can also be used to explore personal motivations.

The process is very simple: the issue under investigation is identified and noted. Examples: “Why are students disengaged from their learning”, “Why are we proposing to hold the meeting?”,  “Why are enrolments dropping?”, “Why do we come to school?”, “Why are teachers not listening?”.

“Why?” is then asked five times (the number of repetitions is not immutable, but in most cases five repetitions have been found to be sufficient).

In this example (Figure 1), year 8 students consider why they study mathematics.

Five Whys: Why do we study mathematics?
Figure 1. Five Whys: Why do we study mathematics?

Some years ago a teacher from a secondary school in Victoria told us the following story.

A class was constantly disrupted by the inappropriate behaviour of a student. Instead of responding in the usual manner by removing the child from the classroom, the teacher took the student to one side and applied the five whys tool to investigate the cause of the behaviour.

The student revealed that he found it difficult to make friends with others in the classroom, and that the behaviour was a means of getting attention and connecting with others.

The teacher worked to help the student learn strategies to develop relationships with others. This was a far more productive and longlasting solution than would have been achieved by reacting to the symptom and removing the student from the classroom.


Watch a video clip of a year 2 student explore why they come to school.

Watch a video clip of a year 4 student exploring the reasons her class comes to school.

Watch a case study video from a year 8 english class that includes the use of Five Whys to explore ‘Why do we study English’?

Purchase Tool Time for Education, which provides details of many improvement tools for schools and classrooms.

Read more about the quality improvement approach in our book IMPROVING LEARNING: A how-to guide for school improvement. 

Learning like a guided walk

I recently had the pleasure of completing a guided walk along the Milford Track – one of the Great Walks in New Zealand. The track passes through some of the most beautiful and pristine wilderness in the world.

During the walk, I was reflecting upon the characteristics of the guided walk that made it so pleasurable. Here are my reflections…

A clear path

The 33.5 miles of track from Glade Wharf to Sandfly Point is clearly laid out and very well maintained. Throughout the walk it was crystal clear where we were meant to go; if we stuck to the track there was little chance of getting lost.

With signposts

The track is clearly and comprehensively sign-posted. Every mile there is a numbered milepost indicating progress.

The track is clear, well maintained and there are regular mile posts.
The track is clear, well maintained and there are regular mileposts.

Periodically there are signs indicating distances or estimated times to key landmarks along the route. These signs, along with the mileposts, enabled each of us to track progress and monitor the pace of our walk.

Regular sing-posts enabled us to monitor our progress

Other signs warn of potential hazards ahead, including areas of possible flooding or avalanche.

Potential hazards are sign-posted

Taken together, these signposts ensured we knew where we were, how far we had come and still had to go, points of interest, and areas where extra care might be required.

Walking at our own pace

We were encouraged to walk the track at our own pace and to take time to explore the locations we found interesting.

We took time to explore locations of interest to us, this being the Clinton River West Arm

We were also encouraged to explore some of the side tracks that had particular points of interest. This was not compulsory. The side trip to Sutherland Falls, the highest falls in New Zealand, was truly remarkable.

Sutherland Falls, the highest in New Zealand. The water falls 580m.
The base of Sutherland Falls, the highest waterfalls in New Zealand. The water falls 580m.

Walking alone, or with others

In all there were about forty of us completing this walk together.

At times I walked alone. I like to do so; it gives me time to think. There were several occasions where it felt like I was the only person on the track. I could see no-one behind or ahead of me, and I felt I had the place to myself.

At times I felt I had the track all to myself

At other times I walked and chatted with my niece, Helen, who had invited me to do the walk with her.

Occasionally, I walked and chatted with small groups of others, some of whom had travelled across the globe to walk this track.

Everyone was free to choose with whom they walked.

A team of professional guides

A team of four guides accompanied us on the walk. They worked extremely well as a team. I was particularly impressed with the way the acknowledged and drew upon their individual strengths while working together to build their individual and collective capability.

Getting to know us

Each of the guides was friendly and welcoming. They each took time to speak with each of us and get to know a bit about us. They genuinely cared about each walker and were keen to ensure everyone had the best experience possible while under their guidance.

As the walk progressed, they learned about our walking style, preferences and limitations. Which of us were the quick walkers, guaranteed to reach each milestone first? Which of us were likely to find parts of the walk particularly challenging?

Mackinnon Memorial at Mackinnon Pass.
Mackinnon Memorial at Mackinnon Pass. The climb up and down the pass was challenging for most of us.

Through getting to know us, the guides were able to plan and execute personalised support, where it was required.

Knowing the track

The guides know the track intimately. Collectively they had walked the track many hundreds of times.

The guides highlighted points of interest and significance along the way. They proved very knowledgeable about the flora and fauna, and took the trouble to point out and help us interpret that we were seeing. We were encouraged to be inquisitive and draw upon their knowledge and experience.

Our guides discuss implications of the weather forecast
Two of our guides discuss implications of the latest weather forecast

They also knew how we might respond to the track. They know where the going is easy. They know where it’s most demanding. They know where people may experience difficulty. They also know the hazards and have strategies to minimise the associated risks.

Helping us be prepared

Each evening one of the guides briefed us on the outlook for the following day. The briefing informed us of the terrain ahead, distances involved, weather forecast, points of interest and any potential areas requiring particular care. This enabled us to plan ahead and be prepared to meet the challenges that lay before us.

The briefings also celebrated our achievements that day.

Briefings each evening celebrated our daily achievements and prepared us for the challenges of the following day.

Providing support, as required

At all times there was a guide at the front of the group. This guide checked the path was clear of hazards.

There was also a guide bringing up the rear, ensuring nobody was left behind. This guide provided encouragement and practical support to those walkers finding the terrain a challenge.

The other two guides walked between, within the group. When we encountered a hazard along the track, there was always at least one guide there to help us through safely. This occurred on three occasions: the first when the track was submerged in flood waters and twice where the track had been obliterated by avalanches.

Guides were always on hand to help us though hazardous sections of track, in this case the site of a recent avalanche.

Celebrating Achievement

Having walked more than 33 miles over four days, we arrived at our destination, Milford Sound. Our final briefing was more of a celebration, each of us receiving a certificate during a simple ceremony, then proceeding to enjoy a meal together.

The following morning, we were treated to a brief cruise through the  sound before we each set off on the next stages of our respective journeys.

Dawn on Mitre Peak, Milford Sound

Learning can be like this guided walk

Schooling can be like this guided walk.

A clear path

The curriculum provides the learning path. Tools such as the Capacity Matrix and Gantt Chart put curriculum in the hands of the learners and provide signposts to support learners to plan and monitoring. Areas where special care may be required can also be highlighted.

Learning at their own pace

Once the path is clear, learners can be encouraged to progress at their own pace.

Learners can also take time to explore areas of particular interest to them, adding these to their capacity matrix and recording details of their learning.

Learning alone, or with others

Students can choose when they prefer to work alone, and when they may wish to work with others. Teams and groupings are by choice, not direction.

A team of teachers

Teachers work together as a team: acknowledging each others’ strengths and working to build their individual and collective capability. They are collectively responsible for the safety and progress of the learners.

Teachers take time to get to know the learners under their guidance: the learners’ aspirations, preferences and limitations.

Teachers know the curriculum intimately. They know where it is straightforward and where many students have difficulty. They encourage curiosity, enquiry and exploration.

Teachers  equip learners with skills and tools to plan and be prepared to make the most of the learning opportunities.

Teachers provide personalised support, helping everyone who requires assistance through all sections of the track. They pay particular attention to supporting learners through sections of curriculum that most people find challenging.

Celebrating achievement

Students and teachers acknowledge and celebrate achievements along the way and in ways that are meaningful to everyone.


Read more about Capacity Matrices.

Watch a video showing how year 7 students learn in this way.

Watch a video showing year 10 students learning in this way.

Purchase our book, IMPROVING LEARNING: A how-to guide for school improvement, and read more.

PE, PDSA and Student Voice

We have previously discussed the power of the Plan-Do-Study-Act (PDSA) cycle in bringing about collaborative, sustainable improvement. We have also emphasised the importance of allowing students to play a key role – giving students a ‘real voice’ – in improving their school and classroom. In this blog, we share another example. This time, how the PDSA process was used by a teacher and students to improve learning and engagement in their physical education (PE) classroom. (You can also view this as a QLA case study video.)

Chris, PE Teacher
Teacher, Chris, with her PE class PDSA storyboard

Chris is a leading specialist teacher at a Victorian primary school. She observed the school’s Year 6 students becoming increasingly disengaged during their weekly PE lessons. PE teachers were stressed and student behaviour was worsening. No one was enjoying PE!

Chris decided it was time to set students and teachers to work to improve PE by applying the PDSA cycle.

As we have seen previously:

PDSA is a highly effective improvement approach, based upon a cycle of theory, prediction, observation, and reflection.

It involves applying a structured process to achieve sustainable improvement.

A nine step PDSA process

This includes:

  • defining the opportunity for improvement by agreeing the purpose and establishing a shared vision of excellence
  • focusing improvement efforts on a system or process (rather than blaming individuals)
  • identifying root causes not symptoms
  • developing and applying a theory for improvement
  • reflecting on the outcomes achieved to agree a new ‘best method’ or further improvement needed.

Here’s how…

Chris applied the PDSA process with her students. They documented a comprehensive storyboard to capture their agreements, the data collected, and to reflect their progress in applying the PDSA process.

Here’s what they did:

  1. Students and teachers discussed to agree the opportunity for improvement – to improve their PE classes.
  2. They studied the current situation – what did PE currently look like, feel like, and what was going on? They agreed: students were disengaged, disinterested and not putting in their best efforts; some students were disrupting the class, preventing others from enjoying PE; and teachers were frustrated.

    CSV014f RHPS PDSA PE.00_00_54_14.Still001
    PDSA storyboard extract: brainstorm of the current situation in PE
  3. They collected data to measure the extent of the dissatisfaction with PE. A correlation chart was used to measure student
    CSV014f RHPS PDSA PE.00_01_30_08.Still002
    PDSA storyboard extract: collecting data using a correlation chart – how much are students enjoying and learning in PE?

    perception. The data revealed low levels of student enjoyment
    (fun) and learning in the PE classroom.

  4. Students then brainstormed and themed the drivers and barriers associated with motivation and participation in their PE classroom. They used sticky notes and an affinity diagram to facilitate this. The major barriers they identified were: ‘inappropriate behaviour’, ‘boring classes’, ‘lack of student choice’, ‘the weather’ and ‘wasting time’.

    CSV014f RHPS PDSA PE.00_01_43_07.Still003
    PDSA storyboard extract: affinity diagram of the barriers to student motivation and participation in PE
  5. These barriers were analysed to agree the root causes using an interrelationship digraph. (They knew that by working on the root causes of their problem that they would realise the greatest return on their improvement efforts.) For the PE students this revealed ‘lack of choice’ as the major or root cause. A lack of choice by students in their PE lessons was seen as a major barrier to participation and motivation. It was impacting upon the other causes and driving the observed problems with behaviour and performance in their classroom.

    CSV014f RHPS PDSA PE.00_02_21_16.Still004
    PDSA storyboard extract: interrelationship digraph analysing the root causes of a lack of student motivation and participation in PE
  6. A bone diagram was used with students to further explore the current situation, and to agree a vision of excellence for PE – what they wanted PE to be like. The resulting student vision showed students believed: student choice, a clear purpose and process for each session, appropriate behaviour, more minor games, a mix of skills, effective use of time, student’s understanding what was expected, and knowing whether they were improving; were the key characteristics students believed were essential for a great PE lesson.

    CSV014f RHPS PDSA PE.00_02_50_14.Still005
    PDSA storyboard extract: bone diagram agreeing a vision of excellence for PE
  7. They brainstormed possible solutions which included: ‘kids teaching kids’,  students ‘choosing activities’ and ‘writing their own report’,   agreeing a student ‘code of behaviour’, clarifying expectations (quality criteria: ‘know what a good throw, jump looks like’), and students ‘making up games’.

    CSV014f RHPS PDSA PE.00_03_29_13.Still007
    PDSA storyboard extract: brainstorm of possible solutions to improve PE
  8. These solutions helped them to develop a ‘theory for improvement’ comprising the following key strategies:
  • multi-voting to agree the focus of each lesson
  • agreeing the lesson format – flowcharting the teaching and learning process
  • appointing student skill coaches and documenting skill cards to help the coaches do their job
  • students undertaking peer evaluation together with their teacher/coach. They developed capacity matrices for key areas of learning to help them to do this. They also documented quality criteria describing how to execute essential skills with a high degree of excellence (e.g. how to do an overhand throw). Students used the capacity matrices and quality criteria as the basis for reflection and evaluating their progress in PE
  • agreeing a code of behaviour
  • everyone reflecting and giving feedback after each lesson.
CSV014f RHPS PDSA PE.00_03_46_16.Still008
PDSA storyboard extract: agreed strategies to improve PE
CSV014f RHPS PDSA PE.00_04_32_02.Still010
PE – capacity matrix for gymnastics
CSV014f RHPS PDSA PE.00_04_48_15.Still012
PE – quality criteria for an overhand throw

The outcome?

The PE classes applied the agreed strategies and new processes, and a few weeks later reflected on the effectiveness of the improvements they had made (the ‘study’ phase of the PDSA
process).

  • Behaviour and engagement improved. Students were motivated and learning
  • Students ‘owned’ and were running the PE lessons with minimal guidance from PE teachers! They were responsible for their learning
  • PE lessons had a productive ’buzz’! Students were excited. Teachers were happy.

The processes they had developed together were adopted as the new way for PE lessons.

Chris described the PDSA based collaborative process as having an amazing impact.

Applying the PDSA process, working ‘with the kids’ and not  ‘doing to the kids’,  brought about significant positive change to PE lessons – improving the way teachers were teaching and students were learning – to great effect!

Learn more…

Download the detailed 9-step PDSA poster.

Purchase IMPROVING LEARNING: A how-to guide for schools, to learn more about the quality improvement philosophy and methods.

Purchase our learning and improvement guide: PDSA Improvement Cycle.

Watch a video of PDSA applied to year one writing.

Watch a video of PDSA applied within a multi-age primary classroom.

Watch a video about student teams applying PDSA to school improvement.

Plan-Do-Study-Act

Creating a theory for improvement

Continual improvement is derived, in large measure, from the efforts of individuals and teams working together to bring about improvement. For example, many schools have introduced professional learning teams (PLTs). PLTs usually involve teams of teachers working together on agreed improvement projects aimed at improving classroom learning and teaching practice.

Sadly, ‘how’ we work on these improvement efforts is frequently left to chance. The result is valuable time and effort wasted as sub-optimal solutions are derived.  So how can we make the most of these rich opportunities to improve?

The answer lies in applying a scientific approach to our improvement efforts – a structured learning and improvement process. Many know this as action learning or action research. We call it PDSA: the Plan-Do-Study-Act improvement cycle.

The history of PDSA

The PDSA cycle is attributed to the work of Walter Shewhart, a statistician working with the Bell Telephone Laboratories in New York during the 1930s (although it can be traced back further to John Dewey’s profound writings on education in the 1800’s). 

Shewhart was the first to conceptualise the three steps of manufacturing — specification, production, and inspection – as a circle, rather than a straight line. He observed that when seeking to control or improve quality, there must be reflection upon the outcomes achieved (inspection) and adjustments made to the specifications and production process.

He proposed the move from this:

The linear process of specification, production and inspection
Figure 1. The linear process of specification, production and inspection

To this:

The cycle of specification, production and inspection
Figure 2. The cycle of specification, production and inspection

You may notice similarities with the traditional teaching methods of plan, teach, and assess.

The linear approach to Plan, Teach, Assess
Figure 3. The linear approach to Plan, Teach, Assess

In recent times there has been a focus in schools on “assessment for learning” (in contrast to “assessment of learning”). It parallels Shewhart’s observation of the need to close the loop in manufacturing.

Shewhart went on to identify the three steps of manufacturing as corresponding to the three steps of the dynamic scientific process of acquiring knowledge: making a hypothesis (or theory), carrying out an experiment, and testing the hypothesis (see Figure 4).

The three steps of acquiring knowledge
Figure 4. The three steps of acquiring knowledge

Source: Adapted from Walter Shewhart, 1986, Statistical Method from the Viewpoint of Quality Control, Dover, New York, p. 45.

With these thoughts, Shewhart planted the seeds for W. Edwards Deming to develop the Plan-Do-Check-Act cycle, which was published as the Shewhart cycle in 1982. Deming taught the Shewhart cycle to the Japanese from 1950 who picked it up and renamed it the Deming Cycle.

The PDSA Cycle

Deming published the cycle in The New Economics in 1993, as the Plan–Do–Study–Act (PDSA) cycle. He changed “check” to “study” in order to more accurately describe the action taken during this step. PDSA is the name by which the cycle has become widely known in recent times. (Figure 5.)

The Deming Cycle
Figure 5. The Deming Cycle

Source: W. Edwards Deming, 1993, The New Economics: For industry, government, education, MIT, Cambridge.

The Plan-Do-Study-Act cycle is a structured process for improvement based on a cycle of theory, prediction, observation, and reflection.

There are, of course, many variants of the improvement process, with many and varied names. In overview, the concepts are the same.

There is a strong tendency for people to want to race through the “plan” stage and get straight into the “do” stage. Schools in particular find it difficult to make time for the reflective step of “study”. Many individuals and teams just want to get into the action and be seen to be making changes, rather than reflecting on whether the change has been an improvement, or just a change.

A detailed and structured process

Where an improvement opportunity is of a significantly complex nature, a comprehensive application of the PDSA process is necessary.

Our work in industry, government and education over the past two decades has shown the nine step PDSA process, illustrated in Figure 6, to be particularly effective. This nine step process has been compared with dozens of alternate models of PDSA and refined over the past two decades.

A nine step PDSA process
Figure 6. A nine step PDSA process

In developing such a process, there is a balance to be struck between the technical considerations of having a robust process that will deal with diverse contexts and issues, and the simplicity that makes the improvement process accessible and practical for busy people. Over the years, we have continually sought to simplify the model to make it more accessible. For nearly a decade, the nine steps have remained constant, but the specific actions and tools comprising each step have been progressively refined.

The process has beed designed to ensure it meets the criteria necessary to achieve sustainable improvement, namely:

  • Be clear about mutually agreed purpose
  • Establish a shared vision of excellence
  • Focus upon improving systems, processes and methods (rather than blaming individuals or just doing things)
  • Identify the root causes of dissatisfaction, not the symptoms
  • Carefully consider the systemic factors driving and restraining improvement, including interaction effects within the system and with containing systems
  • Identify strengths to build upon as well as deficiencies to be addressed
  • Identify the clients of the improvement efforts and understand their needs and expectations
  • Achieve a balance in addressing the competing, and sometimes contradictory, needs and expectations of stakeholders in improvement efforts
  • Be clear about the theory for improvement, and use this to predict outcomes
  • Reflect on the outcomes of improvement efforts, in the context of the selected theory for improvement, in order to refine the theory for improvement
  • Use operational definitions to ensure clarity of understanding and measurement
  • Not copy others’ practices without adequate reflection about their proper implementation in a new context — adapt not adopt.

These requirements have been reflected in the nine step PDSA improvement process shown in Figure 6.

To provide clear guidance, we have developed a comprehensive PDSA chart (Figure 7). The PDSA improvement process is framed as a series of questions to be answered by the improvement team (or individual). These questions address the considerations necessary to achieve sustainable improvement as detailed above. The process also refers the user to specific quality learning tools that can be used to address the questions, promoting collaboration and evidence-based decision-making.

A detailed nine-step PDSA cycle
Future 7. A detailed nine-step PDSA cycle

This is not a perfect process for improvement — there is no such thing. It is a process for improvement that can be adapted (not adopted), applied, studied, and improved. It can be used as a starting point for others, like you, who may wish to create a process of their own.

There are enormous benefits to applying a standard improvement process: an agreed improvement process that everybody follows. This can be standard across the school or whole district. Everyone can use the same approach, from students to superintendent. The benefits, apart from maximising the return on effort, time and resources, include having a common and widely used model, language, set of concepts, and agreed tools.  It also establishes an agreed process that can itself be reviewed and improved, with the contribution of everybody in the organisation.


Watch a video of PDSA applied to year one writing.

Watch a video of PDSA applied within a multi-age primary classroom.

Read or watch a video about student teams applying PDSA to school improvement.

Download the detailed nine-step PDSA chart.

Purchase IMPROVING LEARNING: A how-to guide for school improvement to read more about the quality improvement philosophy and methods.

Purchase our Learning and Improvement Guide: PDSA Improvement Cycle.


How to gauge consensus – use a Consensogram

Quality learning provides administrators, educators, and students with the thinking and practical quality improvement tools necessary to continually improve schools, classrooms and learning. The Consensogram is one of these powerful and easy-to-use quality improvement tools.

Image of a consensogram
A consensogram

The Consensogram facilitates collaboration to support planning and decision making through the collection and display of data. It can be used to gain important insights into the perceptions of stakeholders (most often relating to their level of commitment, effort, or understanding).

The quick-to-construct chart reveals the frequency and distribution of responses. Although anonymous, it allows individuals to view their response in relation to the others in the group.

The Consensogram gives voice to the silent majority and perspective to the vocal minority.

At QLA, we use frequently use the Consensogram: applying it to diverse situations for the purpose of obtaining important data to better inform ‘where to next’.

How to

  1. Predetermine the question relating to the data to be collected.  Make sure the question is seeking a personalised response – it contains an “I” or “my” or “me”. We want people to give their view. E.g. “To what degree am I committed to…” or “To what degree do I understand…”  It can help to begin the question with ‘To what degree…’
  2. Predetermine the scale you wish to use. The scale may be zero to 10 or a percentage scale between zero and 100 percent.
  3. Issue each person with one sticky note. Make sure the sticky notes are all the same size. Colour is not important.
  4. Explain that you want people to write a number on their sticky note in response to the question posed.
    • No negative numbers.
    • If using the zero to 10 scale: the number should be a whole number (not a fraction e.g. 3¾ or 3.75, 55%), and a six or nine should be underlined so they can be distinguished.
    • If using the zero to 100% scale, the numbers should be multiples of ten percent, i.e. 0%, 10%, 20%, and so on.
    • Names are not required on the sticky notes.
  5. Ask people to write down their response. This shouldn’t take long!
  6. Collect the sticky notes and construct the Consensogram, usually on flip chart paper. Label the consensogram with the question and a vertical axis showing the scale.
  7. Interpret the Consensogram with the group and use it to inform what to do next.
  8. Capture a record of your Consensogram by taking a photograph or saving the data on a spreadsheet. You can use a Consensogram template.

Some examples

Students feeling prepared for high school

Consensogram: students feeling prepared for high school

This first example was prepared by a classroom teacher to determine how confident Year 6 students were feeling about their transitioning to high school.

So what do the data reveal?

  • There is significant variation; the students believe they are prepared to different degrees for their move to high school (scores range from 10 to 4).
  • There is one outlier (special cause) – that is; one student who is  having a very different experience to others in the class (giving a rating of one). They report that they feel unprepared for the transition.

So where to next?

  • There is opportunity to improve student confidence by working with the whole class to identify and work together to eliminate or minimise the biggest barriers to their feeling prepared.
  • There is opportunity to invite the student who is feeling unprepared to work with the teacher one-on-one (case manage) to address their specific needs for transiting. This student should not be singled out in front of the class, but an invitation issued to the whole class for that individual to have a quiet word with the teacher at a convenient time. The ensuing discussion may also inform the transitioning process for the rest of the class.


Student engagement

This example was created during a QLA professional development

Consensogram: how engaged are students in my classroom?

workshop with a small group of 11 teachers.

The question was: “To what degree are my students fully engaged: taking responsibility for their learning, setting their own goals and tracking their progress?”

So what do the data reveal?

  • There is variation; the teachers believe their students are at different levels of engagement in their classroom.
  • The data appears normally distributed data (a bell curve); there are no outliers (special causes) – that is; none of the teachers are having a very different experience to others in the group.

So where to next?

  • There is opportunity to improve student engagement; all of the data points are below 5 on the scale.
  • This data can help the group to understand the agreed current state and can motivate people to engage with improvement. It can also provide baseline data to monitor the impact of improvement efforts in the future.

Commitment to school purpose

This example was created during school strategic planning with key stakeholders of a small school (parents, staff and students). A draft

Consensogram: how committed am I to our school purpose?

purpose statement was developed using stakeholder input (using a P3T Tool). The Consensogram was then used to measure the level of commitment to the draft statement. The question was: “How committed am I personally to the purpose of the school?”

The use of the Consensogram averted the need for long, frequently unproductive dialogue. It revealed the following:

  • There is variation; the stakeholders exhibit different levels of commitment to the school purpose.
  • Most are stakeholders are highly committed (the majority indicating a commitment level of 8-10).
  • A group of five stakeholders are less committed (a commitment level of 4-6). Their experience may be different to others in the group.

So where to next?

  • This presents an opportunity to invite the stakeholders with a different experience to share. It is very likely something can be learned to improve the purpose statement for everyone.

Learn more…

Watch a video example of a Consensogram being used for school planning (Hargraves System Mapping) on YouTube.

Investigate the key quality  improvement tools and concepts underpinning the use of the Consensogram, plus more examples in Improving Learning: A how to guide for school improvement.

Purchase a Using data to improve guide.

Download a Consensogram MS Excel template.

May the force be with you!

The Forcefield Analysis is another important tool in our quality improvement toolbox. It helps us to focus on getting the right things right.

Forcefield Analysis
Forcefield Analysis

A Forcefield Analysis is used to examine the forces driving and inhibiting progress in any area of endeavour. It was developed by Kurt Lewin. Lewin was one of the most influential social psychologists of the 20th century, recognised for his pioneering work in organisation dynamics and change.

The theory is based upon an understanding that our organisations exist in a state of equilibrium. Driving and restraining forces ‘hold’ the organisational system in the observed steady state. If we wish to move the system to a new state, we must alter the forces acting on the system and shift the equilibrium.

And here’s the most important point when it comes to improving systems:

We derive a greater return on our improvement efforts by working to minimise the restraining forces, than by increasing the driving forces.

Of course, applying effort to maintain the driving forces is important. However, the restraining forces represent the longest levers to improvement.

Once the restraining forces are identified, the relative contribution of each can be established. This can be achieved through further data collection, or by working with the people with the greatest understanding of the area under study.

We offer a couple of examples to illustrate this in practice.

Force-Field Analysis of the factors driving and preventing a perfect class

The first Forcefield Analysis was developed by students working with their teacher to improve their classroom. Together they brainstormed the forces they believed were helping to create a perfect learning environment, and then, the forces preventing this desired state. They then used Multi-voting; each student applied three votes (star stickers) to the list of preventing forces. A ‘lack of self-control’ was the preventing force they agreed was having the greatest negative effect. They then went on to agree how they could work on their self-control – with great results!

Force-Field Analysis of individuals' experience of change
Force-Field Analysis of individuals’ experience of change

In this second example, we used the Forcefield Analysis in a workshop to explore participants’ experience of change. They used pink sticky notes to record what they believed were the driving forces of successful change, and yellow sticky notes to document the forces they believed inhibited change efforts. An Affinity Diagram was used to identify the themes of both the driving and inhibiting forces. The themes were arranged in order of the frequency in which they occurred, as a Pareto Chart. This was a most insightful exercise; helping participants to reflect on, and improve, their improvement efforts. They identified steps they can take to ensure that the greatest restraining forces are minimised in planning future change processes.

How to

  1. Use poster size paper (or smaller for individual use) with sticky notes or write directly onto the paper.
  2. Draw up a Forcefield Analysis template. Write down the goal. Divide the page into two columns. Label each column, one driving forces and the other restraining forces:

    Forcefield Analysis Template
  3. Brainstorm a list of the driving forces.
  4. Brainstorm a list of the restraining forces.
  5. Prioritise the restraining forces using Multi-voting and/or an Interrelationship Digraph. (You may need to collect data to do this well!)
  6. Develop a plan to overcome the prioritised restraining force/s.

Find out more…

Learn more about Quality Learning tools.

Purchase a Tool Time for Education or Tool Time for Business recipe book.

We’d love to hear about your experiences using the Forcefield Analysis tool. Please comment.

2 Ways Students Can Lead School Improvement

Students have a great deal to contribute to school improvement.

We made this point in a previous blog post What the school improvement Gurus are not yet talking about.

Many schools are currently promoting ‘student voice’ – a feature of many school improvement models.  However our experience shows that this rarely extends beyond a Student Representative Council where a few selected students have the responsibility to collect periodic feedback from students or engage with school fundraising activities. This is a limited view of student voice.

Quality Learning theory emphasises the importance of working together to improve and involving the ‘worker at the front line’ in improving the system. In schools this is the student.

Student contribution begins in the classroom

Students’ potential to lead improvement begins in the classroom. Every student can reflect upon what helps him or her to learn and what hinders learning. Students, with their teacher, can use Quality Learning tools to share, explore and prioritise these driving and restraining forces. A Parking Lot is a good way to collect this data on an ongoing basis. (See our previous blog post Put up a Parking Lot!)

John Hattie in his book Visible Learning (2009) discusses feedback as in the ‘top 10’ greatest influences on student learning. He emphasises the importance of of student-to-teacher feedback (not just the more commonplace teacher-to-student kind).

Based on considered student feedback, teachers and students can jointly design and trial changes to classroom processes, with the aim of improving learning. The class can evaluate the effectiveness of these changes over time. The changes can then be:

  • adopted as ongoing practice;
  • adapted, modified and trialed again;
  • or abandoned.

In this way, students engage in the Plan-Do-Study-Act cycle of learning and improvement.

PDSA Cycle
Plan-Do-Study-Act Cycle, as described by Dr W Edwards Deming

Engaging students in classroom improvement like this has four key benefits.

  1. Teachers can learn a great deal from listening to their students discuss what helps and hinders their learning. This also develops student metacognition and builds capacity in ‘learning how to learn’.
  2. Engaging students in the PDSA cycle of improvement teaches them a practical ‘how to’ approach to improvement, which they can then apply to their own opportunities for improvement. These lessons have practical application beyond schooling.
  3. Engaging students in improving their own situation builds student ownership of the process and outcomes. The teacher has the active support of students in developing, trialling and evaluating a jointly developed theory for improvement.
  4. If the trial is successful, student learning will improve. If it is not successful, students have benefited from experience with the PDSA cycle. An alternative theory can be developed and trialled.

Student contribution to whole-school improvement

In addition to contributing to improving learning in the classroom, students have a significant contribution to make to whole-school improvement. In most schools, this potential remains unexplored, let alone realised.

There are many more students than adults (teachers, administrators and support staff) in most schools. While student-teacher ratios vary enormously by school type and sector, it is generally true that students outnumber adults by more than five to one in most schools. In some places, the ratio is more than ten to one.

The adult populations in schools are diverse; this is even more so for most student populations. There is a rich diversity of backgrounds, languages, cultures, experiences and skills in both the adult and student populations in all schools. This is more pronounced in some schools than others, but it is always present. (Such is the nature of variation in social systems).

Yet in most schools, school improvement is the domain of adults alone.

It doesn’t have to be this way.

The enormous potential of student creativity remains untapped in most schools. Young people have not yet learned some of the constrained thinking that we tend to acquire through life. Students can ask the obvious questions that we don’t even see and have ideas for improvement we could never dream of.

Hallett Cove R-12 School
Student Improvement Teams

Students can lead and participate in improvement teams to address key issues of concern.  We have worked with student teams over many years on school, community and industry-based improvement projects. They have never failed to do a remarkable job.

Students from the Student Leadership Team at Hallett Cove R-12 School in South Australia recently participated in a rigorous process of school improvement using the PDSA cycle.

Ten teams were formed looking at issues that affected them within their school.

Student teams worked out how to make things better, not just different.  They wanted things to get better, and stay better.  They made considered recommendations for sustainable improvement.
Student Improvement Teams from Hallett Cover R-12 School, South Australia

The objectives of the process were for students to:

  • learn more about the Quality Learning approach to improvement
  • learn first-hand about managing and improving organisations
  • develop skills in teamwork, goal setting, time management and communication
  • reflect upon and share what was learned
  • make significant improvements to the school and classroom!

The process comprised three phases:

  1. Training Day
  2. Four-day PDSA School Improvement Experience
  3. An Evaluation Meeting.

The Training Day introduced the knowledge and skills needed to participate in the improvement process. This training included the Principles of Quality Learning and some of the Quality Learning tools.

Phase 2 was where the bulk of the work was done. Students analysed a school situation or process, using the PDSA cycle and Quality Learning tools, to understand the system, identify root causes, develop solutions and make recommendations. To do this the used the following process (and tools):

1 Select the team

1.1 How will team members work together? (Code of Cooperation)

1.2 How will the team keep track of ideas and issues? (Parking Lot)

2 Clarify the opportunity for improvement

2.1 Precisely what is the opportunity for improvement? (Problem Statement)

2.2 Who are the clients and what do they need? (Perception Analysis)

3 Study the current situation

3.1 What is the current process flow, policy and/or state of relationships? (Deployment Flow Chart and/or Affinity Diagram)

4 Analyse the causes

4.1 What are the possible causes of variation and poor performance? (Fishbone Diagram)

4.2 What are the root causes of variation and poor performance? (Hot Dot and Interrelationship Digraph)

4.3 What data are needed to measure performance? (Measures Selection Matrix)

4.4 What do the data say about current performance? (Check Sheets, Run Charts, Pareto Charts)

5 Develop a theory for improvement

5.1 What are the possible solutions, and which will have the greatest impact? (Potential Improvements Matrix)

5.2 What are the recommendations for action, including time lines and responsibilities? (Gantt Chart)

5.3 How will the recommendations be communicated?

On the final afternoon, teams presented their findings to the school leadership team. The other Student Teams were also present. Their findings were presented as a written report and a presentation.

The Evaluation Meeting occurred in the days following the report presentation and provided an opportunity to give feedback to the school about their experience.

The many excellent recommendations were acted upon in the weeks that followed, and have made lasting and significant improvements to the school.

In the words of Andrew Gohl, Assistant Principal:

The PDSA cycle provides a structure and a clear process that people can work through, that is inclusive of all voices: regardless of whether you are the very young, the very old, the very vociferous, the very quiet. There’s a clear process there for everyone to have a voice, for everyone to be heard. And, of course, in that inclusiveness, the outcome is one which meets everybody’s needs.

Watch the video that tells the story of the Hallett Cove R-12 School Student Teams.

Put up a Parking Lot!

Unlike in the well-known Joni Mitchell (or for those of you who are younger, the Counting Crows) Big Yellow Taxi song, putting up a Parking Lot can be a very positive and productive experience. Especially when the Parking Lot is a Quality Learning tool!

Like the key message in the song, the Parking Lot can prevent us from taking things for granted, and missing opportunities – but in a very different way.

ParkingLotOur colleague and friend David Langford was responsible for the ‘construction’ of this Parking Lot.

The Quality Learning Parking Lot enhances communication and supports our continual improvement efforts.

The purpose of a Parking Lot is to
gather feedback from stakeholders.
It is where we ‘park’ ideas for improvement.

The Parking Lot can be used to gather group, team or individual feedback, ideas and reflections. Stakeholder feedback is usually collected anonymously. This allows people to provide honest feedback in a safe and trusting environment.

How to…

Easier to construct than a traditional parking lot, (no need for a bulldozer and tons of concrete!) – all we need is paper and a pen. The Parking Lot can be as creative and colourful as your imagination allows (and students make great Parking Lots!). Here’s how:

  1. Use poster size paper (or smaller for individual use).
  2. Draw up the Parking Lot to capture thinking in four main areas:
    • +: What is going well?
    • Δ: What can we improve?
    • ?: What are the questions?
    •  I: What are the issues or ideas?
  3. Gather the feedback using either sticky notes, or allow people to write directly onto a template. Ask users to place their feedback directly onto the quadrant it relates to.
  4. Collate the feedback (where sticky notes have been used, an Affinity Diagram can help with this).
  5. With the stakeholder/s: discuss, explore, agree priorities, and action.

A word of warning: don’t ask for feedback if you are not prepared to discuss and act upon it!

When and where…

At QLA, we use a Parking Lot to collect feedback during meetings, professional development and support sessions. That way we can improve the process during the session, rather than wait to gather feedback at the end, when it is too late to attend to the needs of the current participants.

Here are some other ideas for application:

Passionate_Educator_300 Educator

  • As a basis for classroom meetings. Ask students to place their ideas as they emerge during classroom and learning activities during the week. Students take it in turns to chair a meeting. Each idea is read out and the appropriate action determined and agreed to by students in consultation with the teacher. Actions and agreements can be recorded using an Decision and Action Record.
  • To obtain student feedback on programs, units of work, lessons, excursions, activities, homework, the effectiveness of teaching strategies.
  • To structure group or individual reflection on learning.
  • As part of a class project or Plan-Do-Study-Act (PDSA) improvement process to capture ongoing feedback and ideas.

Innovative_School_Leader_300 School Leader

  • Posted in the school’s reception area to collect ongoing feedback from parents and families on various aspects of school life and activities.
  • During meetings to evaluate effectiveness and ‘park’ ideas and issues that emerge that the current agenda may not allow time for.
  • To gather input from staff to evaluate a program, professional development, school processes (as part of a post–process review – e.g. reporting to parents, school camp), to improve the process for next time.
  • As part of a project or Plan-Do-Study-Act (PDSA) improvement process to capture ongoing feedback and ideas as the project progresses.

Dedicated_School_System_Leader_300School System Leader

  • During meetings to evaluate effectiveness and ‘park’ ideas and issues that emerge that the current agenda may not allow time for.
  • To gather input to evaluate, progress and/or improve a project, program, professional development, processes.
  • As part of a Plan-Do-Study-Act (PDSA) improvement process to capture ongoing feedback and ideas as the process progresses.

Supportive_Family_Community_Leader_300Family and Community Member

  • To structure group or individual reflection on learning.
  • During meetings to evaluate effectiveness and ‘park’ ideas and issues that emerge that the agenda does not allow time for, so they are not lost.

Business_Government_Leader_300Business or Government Leader

  • During meetings to evaluate effectiveness and ‘park’ ideas and issues that emerge that the agenda does not allow time for, so they are not lost.
  • To gather input to evaluate, progress and/or improve a project, program, professional development, processes.
  • As part of a Plan-Do-Study-Act (PDSA) improvement process to capture ongoing feedback and ideas as the process progresses.

Find out more…

Discussion

We’d love to here your experiences with using the Parking Lot!

Please comment here: