Tag Archives: Quality improvement tools

A Correlation Chart

There are many Quality Learning tools for gathering the perspectives of groups of people: Consensogram, Parking Lot, Affinity Diagram, Plus/Delta, Fishbone Diagram, Force-field Analysis, to name a few.

Sometimes it’s desirable to gather views on more than one issue, and to examine the relationship between responses to these issues.

A Correlation Chart is useful for examining the relationship between responses.

Correlation Chart

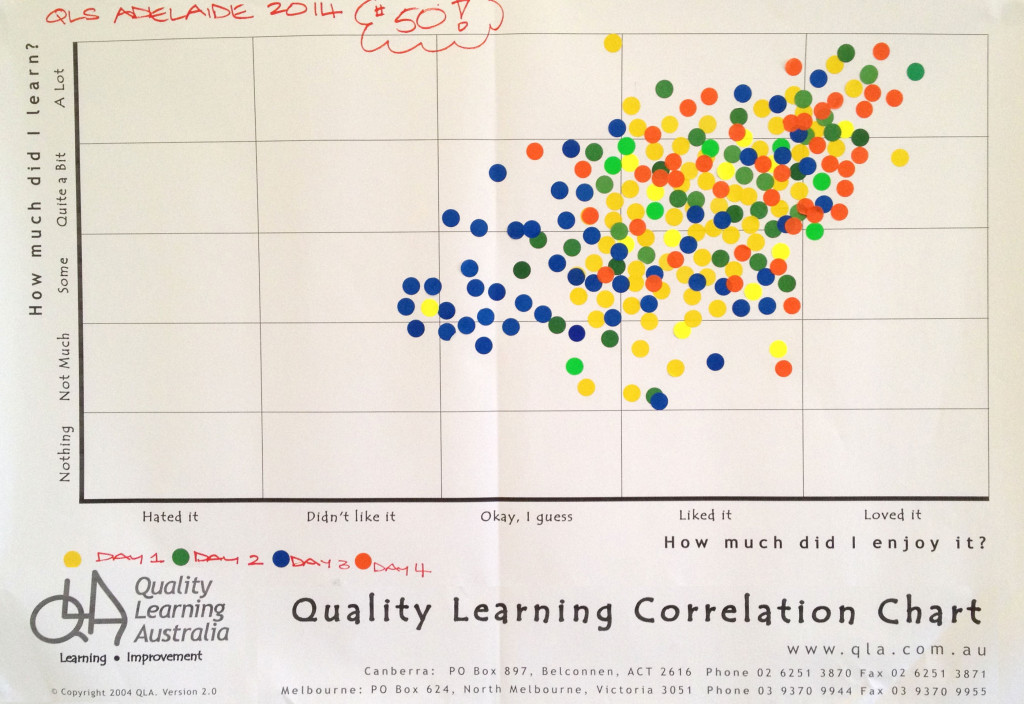
We regularly use a Correlation Chart as a quick and effective way to gather feedback from participants in our workshops. Figure 1 shows a Correlation Chart from a workshop – the 50th four-day Quality Learning Seminar with David Langford held in Australia.
Workshop participant feedback on a Correlation Chart
Figure 1. Workshop participant feedback on a Correlation Chart

Many teachers use a Correlation Chart at the end of a unit of work to gather student feedback on the unit.

Set the questions and scale

The first step when using a Correlation Chart is to decide the questions. The most common question are those shown in Figure 1, namely:

  • How much did you enjoy the workshop/course/unit of work?
  • How much did you learn?

The questions must lend themselves to a scaled response.

Binary questions, which have only two responses such as yes or no, don’t work for a Correlation Chart.

Scales we have seen used effectively include:

  • Frequency: rarely to nearly always
  • Importance: not important to critical
  • Performance: very poor to excellent
  • Amount: nothing to a lot
  • Disposition: hate it to love it
  • Knowledge: never heard of it to mastered it
  • Confidence: not confident to supremely confident.

Whichever scale you choose, respondents will find it helpful if you define ‘anchor points’ along the scale. We typically define five such points. For example, for Frequency:

  • Rarely (10%)
  • Sometimes (25%)
  • Moderately (50%)
  • Mostly (75%)
  • Nearly Always (90%)

Gather and display the data

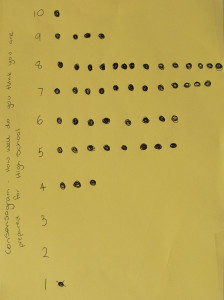
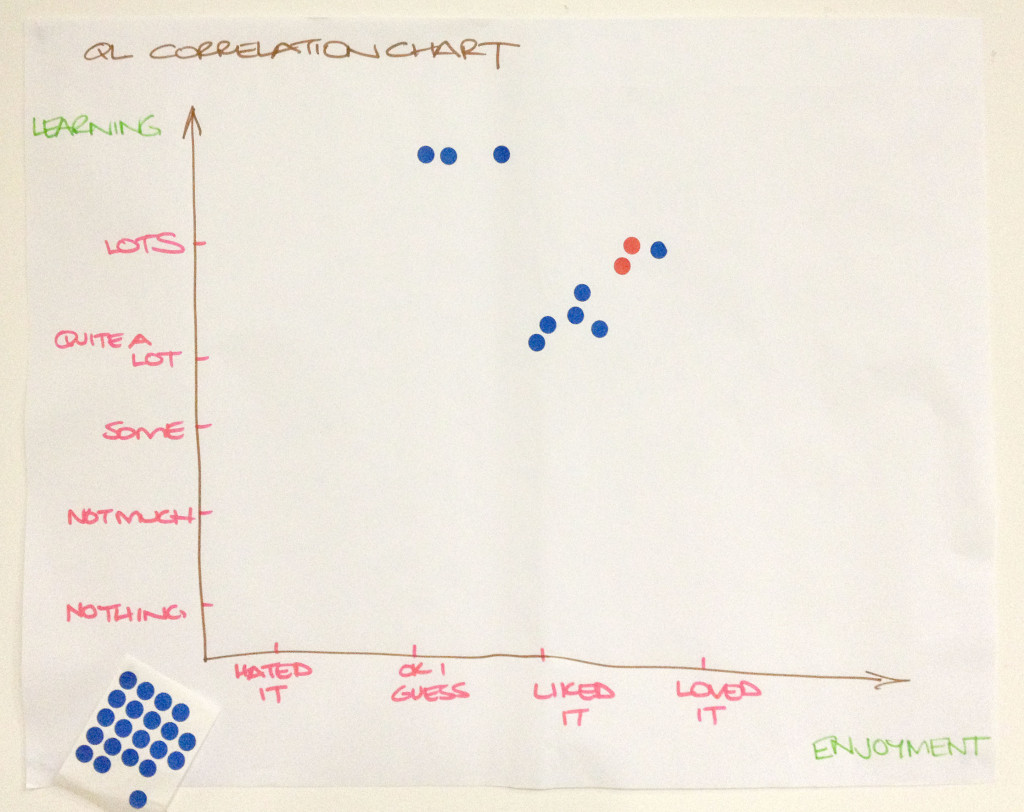
Having determined the questions and scale, the next step is to draw up the correlation chart. It doesn’t have to be typed and printed; hand written charts, such as that shown in Figure 2 work quite well.
A hand-written Correlation Chart
Figure 2. A hand-written Correlation Chart

Provide a sheet of adhesive dots (or a marker pen). Invite respondents to place a dot in the chart in response to the two questions.

Consider the relationship

What patterns can you see in the data? In Figure 1, you will notice the tendency for individuals’ ratings of learning and enjoyment to be quite similar. Those who reported they enjoyed the seminar more tended to report learning more. In other words, there is a positive correlation between these variables.

Remember, correlation does not mean causation. Correlation only indicates a relationship exists, it doesn’t explain the nature of the relationship. In Australia, for instance, there is a correlation between sales of ice cream cones and shark attacks; nobody suggests one causes the other.

Decide what to do next

Data inform decisions. We collect data to help us decide what to do next. Be sure to consider what the data are suggesting you need to do.

Benefits of a Correlation Chart

A Correlation Chart is easy to use. It can easily be made during a staff or class meeting, with the results instantly visible for everyone to see. It is much easier than a survey!

Everyone can see their own dots on a Correlation Chart; they know their voice is heard and that their opinion matters.

Like many of the Quality Learning tools, a Correlation Chart gives voice to the silent majority while giving perspective to the vocal minority. People see how their perspective relates to those of others in the group.

Keep in mind

A Correlation Chart does not provide any information regarding the reasons for the responses. Take care not to attribute reasons without further investigation.

Respect the anonymity of the respondents. If there are outlier responses – special causes – that are clearly different to those of the majority, don’t seek to identify the individuals concerned. Rather, invite the individual(s) to have a quiet word with you later so you can understand their perspective. There is frequently richness in the views of outliers.


Read more about the Quality Learning Tools.

Learn more about the Quality Learning approach from our book Improving Learning: A how-to guide for school improvement.

Purchase David Langford’s Tool Time for Education book, which explains dozens of tools and how to use them.


Quality Learning Tools

Tools to improve the quality of learning

Educators can get very excited by Quality Learning tools. In this post we explore these tools and how to use them most effectively.

Students from Hallett Cove R-12 School in South Australia complete an Inter-relationship Digraph
Students from Hallett Cove R-12 School in South Australia complete an Inter-relationship Digraph.

What is a Quality Learning tool?

Let’s start with a definition of any tool.

A tool is a physical or procedural instrument.

A hammer is a tool, a physical instrument for driving nails. A to-do list is a tool, a procedural instrument for helping us remember what we have to get done. The internet is a tool that requires both a physical instrument (computer or smart phone) and procedures to follow to connect and gain access to information.

A Quality Learning tool is a physical or procedural instrument used to improve the quality of learning.

The Quality Learning tools have their origins in quality improvement tools, first introduced in Japan in the 1960s. These early tools, such as the check sheet, fishbone diagram and Pareto chart, were used to gather and display data with a view to improving the quality of products and services. Management tools, such as the affinity diagram, interrelationship digraph and prioritisation matrix, were developed from the 1970s.

Over the past fifty years, additional tools have been developed in the fields of management, planning, statistical analysis, design, inter-personal collaboration, creativity and thinking.

Quality Learning tools are drawn from all of these areas.

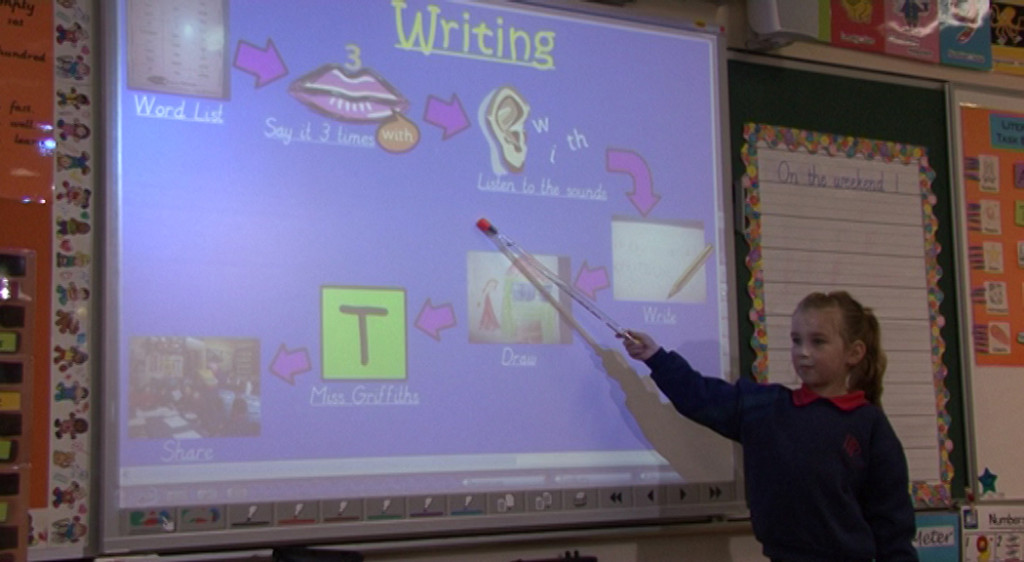
A junior primary student from Plenty Parklands Primary School describes the writing process
A junior primary student from Plenty Parklands Primary School steps through a flowchart of the class writing process.

Tools and new thinking

Tools are created to solve problems.

New tools usually emerge after thinking about a problem from a new or different perspective.

Consider brainstorming, for example. It is a simple tool. Everyone gets to suggest ideas that are recorded for everybody to see. Traditional brainstorming, however, has a number of weaknesses, including potential domination of the group by outspoken individuals and inconsistent levels of participation by group members. These factors frequently impact negatively on the quality of ideas generated.

To address these weaknesses, structured brainstorming was developed. Key differences between structured and traditional brainstorming are:

  1. All individuals are given time to think about the issue quietly and make a list of ideas they could contribute.
  2. Ideas are gathered progressively from each member of the group: one idea per person per turn, with the option to ‘pass’ on any turn.

Structured brainstorming was developed to solve the problems of traditional brainstorming.

The thinking that preceded the creation of the new tool or the new technique was inadequate; otherwise the tool would not have been needed. If the old thinking could have solved the problem, there would have been no need to develop a new tool to help understand the problem better or analyse it better. So the creation of the tool is usually a consequence of a shift in thinking.

Jim Duffy, 2015, Knowing & Applying: Breathing new life into service organisations, Deming Learning Network, Aberdeen, Scotland, p66

The Quality Learning tools are rooted in the thinking that underpins Quality Learning, namely what Deming called a system of profound knowledge. This philosophy can be summarised as the Principles of Quality Learning.

Tools can encourage everybody to have their say, usually in a structured manner. Everyone comes to understand the perspective of the group as a whole. In this way, they give voice to the silent majority while giving perspective to the vocal minority. 

A student from Theodore Primary School in the ACT explains a class Correlation Chart
A student from Theodore Primary School in the ACT explains a class Correlation Chart.

Examples of Quality Learning tools

The following table lists many of the most common Quality Learning tools. They are grouped by the key concepts of Systems, Knowledge, Data and variation, and Psychology and motivation. (Remembering, of course, that these concepts are more strongly interrelated than the following linear list of tools suggests.)

Systems thinking

  • Deployment Flowchart
  • Fishbone Diagram
  • Five Whys
  • Force-field Analysis
  • Imagineering
  • Interrelationship Digraph
  • Paper Passing Purpose Tool (P3T)
  • Parking Lot
  • Perception Analysis
  • Process Accountability Matrix
  • Purpose, Outcomes, Process, Evaluation (POPE)
  • SIPOC Modelling
  • Standard Flowchart
  • System Map
  • System’s Progress
  • Top-down Flowchart

Knowledge and theory

  • Bone Diagram
  • Gantt Chart
  • Hot Dot
  • Lotus Diagram
  • Operational Definition
  • Potential Improvement Matrix
  • Problem Statement

Data and variation

  • Affinity Diagram
  • Box and Whisker Plots
  • Control Chart
  • Dot Plot
  • Histogram
  • Measures Selection Matrix
  • Pareto Chart
  • Radar Chart
  • Run Chart
  • Structured Brainstorming

Psychology and motivation

  • Action and Agreement Record
  • Capacity Matrix
  • Code of Cooperation
  • Consensogram
  • Loss Function
  • Plus Delta

There is no definitive list of Quality Learning tools. New ones are being developed daily; old ones are being adapted to new situations. The list above provides a starting point; it may suggest tools you would like to go back to, or new ones you may wish to explore.

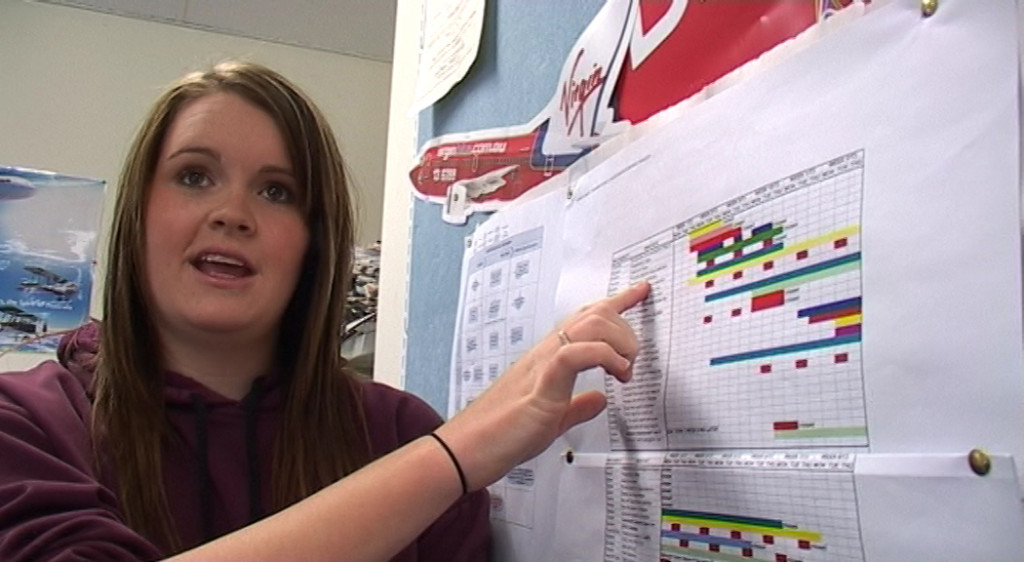
A student from Seaford 6-12 School in South Australia describes the use of a Gantt Chart to plan and track progress of an assignment
A student from Seaford 6-12 School in South Australia describes the use of a Gantt Chart to plan and track progress of an assignment.

Using the tools

As we work with schools and other organisations, one of the most common questions we are asked is: How do I know which tool to use, and when to use it?

The only way to predict whether a tool will be helpful in any given situation is to have tried the tool and learned from its application.

As you use a tool regularly, you come to know the situations in which it is most helpful and those in which it is not.

Learning about the Quality Learning philosophy can also help you apply the tools effectively, as it can deepen your understanding of the thinking behind the tools.


Read more about Quality Learning.

Study the Quality Learning philosophy, as described in our book Improving Learning: A how-to guide for school improvement.

Purchase Tool Time for Education or Tool Time for Business, comprehensive guides to the Quality Learning tools.

Watch a brief video about the use of Capacity Matrices in Primary School or High School.

Watch a brief video about the use of Flowcharts in High School or Primary School.

Watch a brief video about the use of a Gantt Chart in High School.

How to gauge consensus – use a Consensogram

Quality learning provides administrators, educators, and students with the thinking and practical quality improvement tools necessary to continually improve schools, classrooms and learning. The Consensogram is one of these powerful and easy-to-use quality improvement tools.

Image of a consensogram
A consensogram

The Consensogram facilitates collaboration to support planning and decision making through the collection and display of data. It can be used to gain important insights into the perceptions of stakeholders (most often relating to their level of commitment, effort, or understanding).

The quick-to-construct chart reveals the frequency and distribution of responses. Although anonymous, it allows individuals to view their response in relation to the others in the group.

The Consensogram gives voice to the silent majority and perspective to the vocal minority.

At QLA, we use frequently use the Consensogram: applying it to diverse situations for the purpose of obtaining important data to better inform ‘where to next’.

How to

  1. Predetermine the question relating to the data to be collected.  Make sure the question is seeking a personalised response – it contains an “I” or “my” or “me”. We want people to give their view. E.g. “To what degree am I committed to…” or “To what degree do I understand…”  It can help to begin the question with ‘To what degree…’
  2. Predetermine the scale you wish to use. The scale may be zero to 10 or a percentage scale between zero and 100 percent.
  3. Issue each person with one sticky note. Make sure the sticky notes are all the same size. Colour is not important.
  4. Explain that you want people to write a number on their sticky note in response to the question posed.
    • No negative numbers.
    • If using the zero to 10 scale: the number should be a whole number (not a fraction e.g. 3¾ or 3.75, 55%), and a six or nine should be underlined so they can be distinguished.
    • If using the zero to 100% scale, the numbers should be multiples of ten percent, i.e. 0%, 10%, 20%, and so on.
    • Names are not required on the sticky notes.
  5. Ask people to write down their response. This shouldn’t take long!
  6. Collect the sticky notes and construct the Consensogram, usually on flip chart paper. Label the consensogram with the question and a vertical axis showing the scale.
  7. Interpret the Consensogram with the group and use it to inform what to do next.
  8. Capture a record of your Consensogram by taking a photograph or saving the data on a spreadsheet. You can use a Consensogram template.

Some examples

Students feeling prepared for high school

Consensogram: students feeling prepared for high school

This first example was prepared by a classroom teacher to determine how confident Year 6 students were feeling about their transitioning to high school.

So what do the data reveal?

  • There is significant variation; the students believe they are prepared to different degrees for their move to high school (scores range from 10 to 4).
  • There is one outlier (special cause) – that is; one student who is  having a very different experience to others in the class (giving a rating of one). They report that they feel unprepared for the transition.

So where to next?

  • There is opportunity to improve student confidence by working with the whole class to identify and work together to eliminate or minimise the biggest barriers to their feeling prepared.
  • There is opportunity to invite the student who is feeling unprepared to work with the teacher one-on-one (case manage) to address their specific needs for transiting. This student should not be singled out in front of the class, but an invitation issued to the whole class for that individual to have a quiet word with the teacher at a convenient time. The ensuing discussion may also inform the transitioning process for the rest of the class.


Student engagement

This example was created during a QLA professional development

Consensogram: how engaged are students in my classroom?

workshop with a small group of 11 teachers.

The question was: “To what degree are my students fully engaged: taking responsibility for their learning, setting their own goals and tracking their progress?”

So what do the data reveal?

  • There is variation; the teachers believe their students are at different levels of engagement in their classroom.
  • The data appears normally distributed data (a bell curve); there are no outliers (special causes) – that is; none of the teachers are having a very different experience to others in the group.

So where to next?

  • There is opportunity to improve student engagement; all of the data points are below 5 on the scale.
  • This data can help the group to understand the agreed current state and can motivate people to engage with improvement. It can also provide baseline data to monitor the impact of improvement efforts in the future.

Commitment to school purpose

This example was created during school strategic planning with key stakeholders of a small school (parents, staff and students). A draft

Consensogram: how committed am I to our school purpose?

purpose statement was developed using stakeholder input (using a P3T Tool). The Consensogram was then used to measure the level of commitment to the draft statement. The question was: “How committed am I personally to the purpose of the school?”

The use of the Consensogram averted the need for long, frequently unproductive dialogue. It revealed the following:

  • There is variation; the stakeholders exhibit different levels of commitment to the school purpose.
  • Most are stakeholders are highly committed (the majority indicating a commitment level of 8-10).
  • A group of five stakeholders are less committed (a commitment level of 4-6). Their experience may be different to others in the group.

So where to next?

  • This presents an opportunity to invite the stakeholders with a different experience to share. It is very likely something can be learned to improve the purpose statement for everyone.

Learn more…

Watch a video example of a Consensogram being used for school planning (Hargraves System Mapping) on YouTube.

Investigate the key quality  improvement tools and concepts underpinning the use of the Consensogram, plus more examples in Improving Learning: A how to guide for school improvement.

Purchase a Using data to improve guide.

Download a Consensogram MS Excel template.