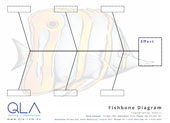
A Fishbone Diagram or Cause and Effect Diagram is an improvement tool used to identify and document the possible causes of a given effect. This is important in considering all the possible causes not simply jumping to solution.
This template can be used to manually document a Cause and Effect diagram.


Related resources
Fishbone Diagram: Variation in Student Achievement
The Fishbone Diagram or Cause and Effect Diagram can be used to identify and document the possible causes of a given effect. This example prepared by QLA documents many of the causes of variation in student achievement.
Most resources on this website are free. For some resources, such as this, we require you to register so that we may keep you informed of Quality Learning news and new resources. Should you choose, you will be able to opt out of our communications at any time.