Tag Archives: Stakeholders

A Correlation Chart

There are many Quality Learning tools for gathering the perspectives of groups of people: Consensogram, Parking Lot, Affinity Diagram, Plus/Delta, Fishbone Diagram, Force-field Analysis, to name a few.

Sometimes it’s desirable to gather views on more than one issue, and to examine the relationship between responses to these issues.

A Correlation Chart is useful for examining the relationship between responses.

Correlation Chart

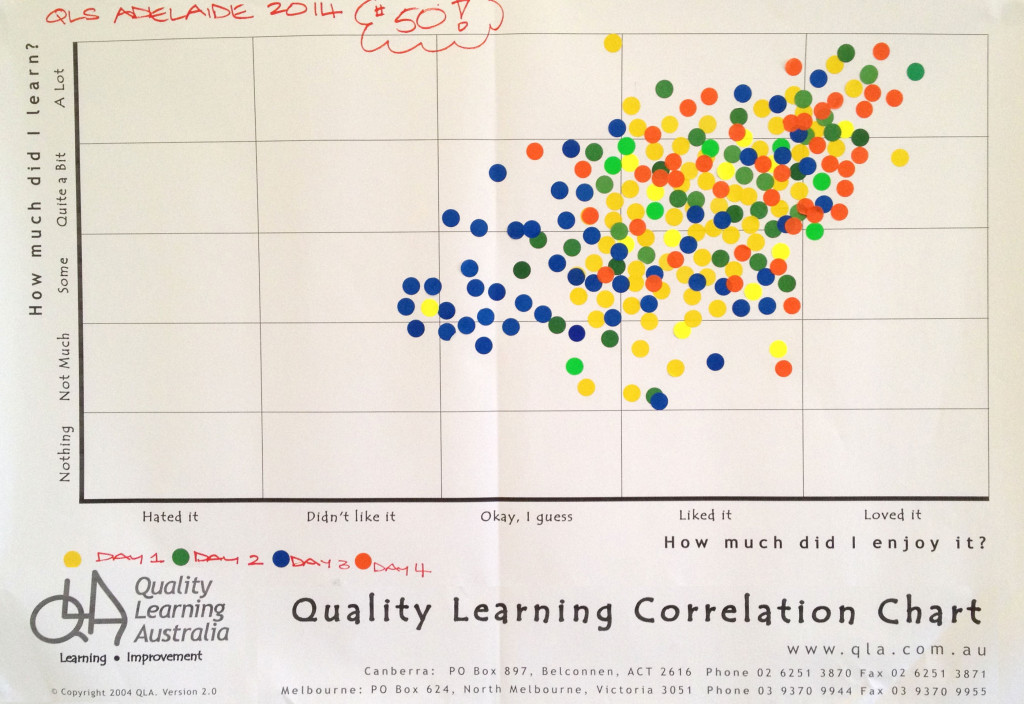
We regularly use a Correlation Chart as a quick and effective way to gather feedback from participants in our workshops. Figure 1 shows a Correlation Chart from a workshop – the 50th four-day Quality Learning Seminar with David Langford held in Australia.
Workshop participant feedback on a Correlation Chart
Figure 1. Workshop participant feedback on a Correlation Chart

Many teachers use a Correlation Chart at the end of a unit of work to gather student feedback on the unit.

Set the questions and scale

The first step when using a Correlation Chart is to decide the questions. The most common question are those shown in Figure 1, namely:

  • How much did you enjoy the workshop/course/unit of work?
  • How much did you learn?

The questions must lend themselves to a scaled response.

Binary questions, which have only two responses such as yes or no, don’t work for a Correlation Chart.

Scales we have seen used effectively include:

  • Frequency: rarely to nearly always
  • Importance: not important to critical
  • Performance: very poor to excellent
  • Amount: nothing to a lot
  • Disposition: hate it to love it
  • Knowledge: never heard of it to mastered it
  • Confidence: not confident to supremely confident.

Whichever scale you choose, respondents will find it helpful if you define ‘anchor points’ along the scale. We typically define five such points. For example, for Frequency:

  • Rarely (10%)
  • Sometimes (25%)
  • Moderately (50%)
  • Mostly (75%)
  • Nearly Always (90%)

Gather and display the data

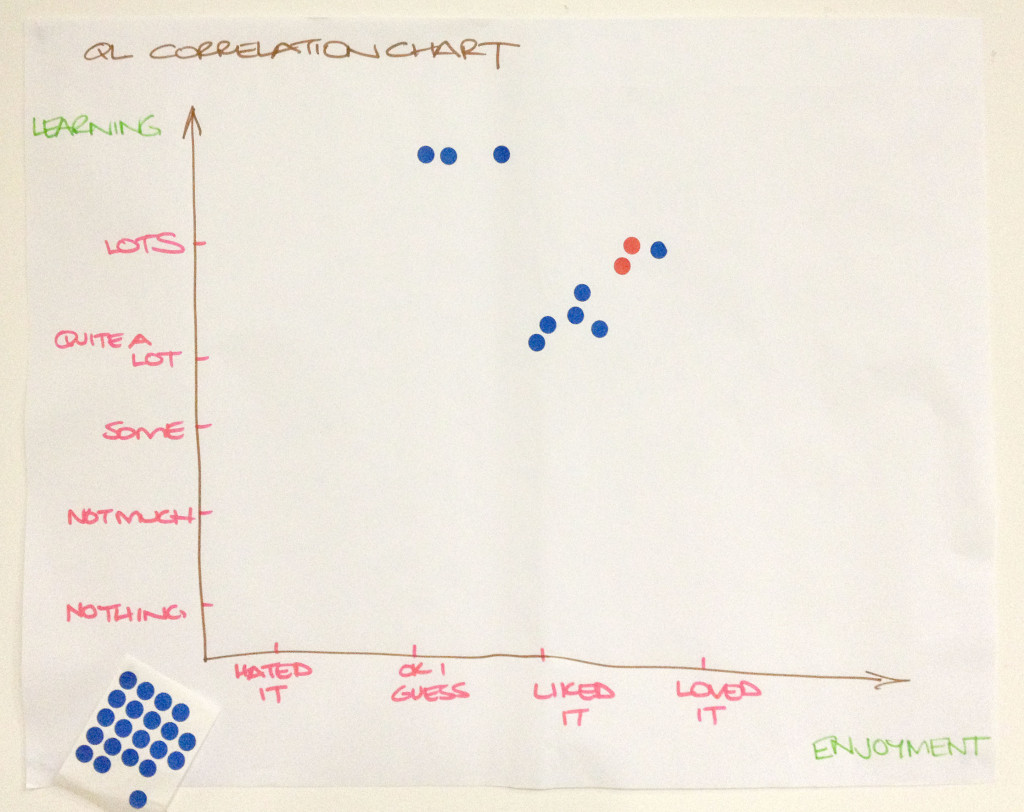
Having determined the questions and scale, the next step is to draw up the correlation chart. It doesn’t have to be typed and printed; hand written charts, such as that shown in Figure 2 work quite well.
A hand-written Correlation Chart
Figure 2. A hand-written Correlation Chart

Provide a sheet of adhesive dots (or a marker pen). Invite respondents to place a dot in the chart in response to the two questions.

Consider the relationship

What patterns can you see in the data? In Figure 1, you will notice the tendency for individuals’ ratings of learning and enjoyment to be quite similar. Those who reported they enjoyed the seminar more tended to report learning more. In other words, there is a positive correlation between these variables.

Remember, correlation does not mean causation. Correlation only indicates a relationship exists, it doesn’t explain the nature of the relationship. In Australia, for instance, there is a correlation between sales of ice cream cones and shark attacks; nobody suggests one causes the other.

Decide what to do next

Data inform decisions. We collect data to help us decide what to do next. Be sure to consider what the data are suggesting you need to do.

Benefits of a Correlation Chart

A Correlation Chart is easy to use. It can easily be made during a staff or class meeting, with the results instantly visible for everyone to see. It is much easier than a survey!

Everyone can see their own dots on a Correlation Chart; they know their voice is heard and that their opinion matters.

Like many of the Quality Learning tools, a Correlation Chart gives voice to the silent majority while giving perspective to the vocal minority. People see how their perspective relates to those of others in the group.

Keep in mind

A Correlation Chart does not provide any information regarding the reasons for the responses. Take care not to attribute reasons without further investigation.

Respect the anonymity of the respondents. If there are outlier responses – special causes – that are clearly different to those of the majority, don’t seek to identify the individuals concerned. Rather, invite the individual(s) to have a quiet word with you later so you can understand their perspective. There is frequently richness in the views of outliers.


Read more about the Quality Learning Tools.

Learn more about the Quality Learning approach from our book Improving Learning: A how-to guide for school improvement.

Purchase David Langford’s Tool Time for Education book, which explains dozens of tools and how to use them.


 

How to gauge consensus – use a Consensogram

Quality learning provides administrators, educators, and students with the thinking and practical quality improvement tools necessary to continually improve schools, classrooms and learning. The Consensogram is one of these powerful and easy-to-use quality improvement tools.

Image of a consensogram
A consensogram

The Consensogram facilitates collaboration to support planning and decision making through the collection and display of data. It can be used to gain important insights into the perceptions of stakeholders (most often relating to their level of commitment, effort, or understanding).

The quick-to-construct chart reveals the frequency and distribution of responses. Although anonymous, it allows individuals to view their response in relation to the others in the group.

The Consensogram gives voice to the silent majority and perspective to the vocal minority.

At QLA, we use frequently use the Consensogram: applying it to diverse situations for the purpose of obtaining important data to better inform ‘where to next’.

How to

  1. Predetermine the question relating to the data to be collected.  Make sure the question is seeking a personalised response – it contains an “I” or “my” or “me”. We want people to give their view. E.g. “To what degree am I committed to…” or “To what degree do I understand…”  It can help to begin the question with ‘To what degree…’
  2. Predetermine the scale you wish to use. The scale may be zero to 10 or a percentage scale between zero and 100 percent.
  3. Issue each person with one sticky note. Make sure the sticky notes are all the same size. Colour is not important.
  4. Explain that you want people to write a number on their sticky note in response to the question posed.
    • No negative numbers.
    • If using the zero to 10 scale: the number should be a whole number (not a fraction e.g. 3¾ or 3.75, 55%), and a six or nine should be underlined so they can be distinguished.
    • If using the zero to 100% scale, the numbers should be multiples of ten percent, i.e. 0%, 10%, 20%, and so on.
    • Names are not required on the sticky notes.
  5. Ask people to write down their response. This shouldn’t take long!
  6. Collect the sticky notes and construct the Consensogram, usually on flip chart paper. Label the consensogram with the question and a vertical axis showing the scale.
  7. Interpret the Consensogram with the group and use it to inform what to do next.
  8. Capture a record of your Consensogram by taking a photograph or saving the data on a spreadsheet. You can use a Consensogram template.

Some examples

Students feeling prepared for high school

Consensogram: students feeling prepared for high school

This first example was prepared by a classroom teacher to determine how confident Year 6 students were feeling about their transitioning to high school.

So what do the data reveal?

  • There is significant variation; the students believe they are prepared to different degrees for their move to high school (scores range from 10 to 4).
  • There is one outlier (special cause) – that is; one student who is  having a very different experience to others in the class (giving a rating of one). They report that they feel unprepared for the transition.

So where to next?

  • There is opportunity to improve student confidence by working with the whole class to identify and work together to eliminate or minimise the biggest barriers to their feeling prepared.
  • There is opportunity to invite the student who is feeling unprepared to work with the teacher one-on-one (case manage) to address their specific needs for transiting. This student should not be singled out in front of the class, but an invitation issued to the whole class for that individual to have a quiet word with the teacher at a convenient time. The ensuing discussion may also inform the transitioning process for the rest of the class.


Student engagement

This example was created during a QLA professional development

Consensogram: how engaged are students in my classroom?

workshop with a small group of 11 teachers.

The question was: “To what degree are my students fully engaged: taking responsibility for their learning, setting their own goals and tracking their progress?”

So what do the data reveal?

  • There is variation; the teachers believe their students are at different levels of engagement in their classroom.
  • The data appears normally distributed data (a bell curve); there are no outliers (special causes) – that is; none of the teachers are having a very different experience to others in the group.

So where to next?

  • There is opportunity to improve student engagement; all of the data points are below 5 on the scale.
  • This data can help the group to understand the agreed current state and can motivate people to engage with improvement. It can also provide baseline data to monitor the impact of improvement efforts in the future.

Commitment to school purpose

This example was created during school strategic planning with key stakeholders of a small school (parents, staff and students). A draft

Consensogram: how committed am I to our school purpose?

purpose statement was developed using stakeholder input (using a P3T Tool). The Consensogram was then used to measure the level of commitment to the draft statement. The question was: “How committed am I personally to the purpose of the school?”

The use of the Consensogram averted the need for long, frequently unproductive dialogue. It revealed the following:

  • There is variation; the stakeholders exhibit different levels of commitment to the school purpose.
  • Most are stakeholders are highly committed (the majority indicating a commitment level of 8-10).
  • A group of five stakeholders are less committed (a commitment level of 4-6). Their experience may be different to others in the group.

So where to next?

  • This presents an opportunity to invite the stakeholders with a different experience to share. It is very likely something can be learned to improve the purpose statement for everyone.

Learn more…

Watch a video example of a Consensogram being used for school planning (Hargraves System Mapping) on YouTube.

Investigate the key quality  improvement tools and concepts underpinning the use of the Consensogram, plus more examples in Improving Learning: A how to guide for school improvement.

Purchase a Using data to improve guide.

Download a Consensogram MS Excel template.

Sharing a Vision

The importance of shared vision

At its simplest level, a shared vision is the answer to the question,
“What do we want to create?”
Peter Senge, 1990, The Fifth Discipline, p206.

A shared vision is a mutual agreement as to the desired future state key stakeholders are working together to create. It helps to align effort, optimise contribution, and to maximise organisational performance and improvement.

Many organisation improvement models recognise the importance of establishing a shared vision. The National School Improvement Tool (ACER 2012) describes the need for; ‘an explicit improvement agenda’. The Australia Business Excellence Framework (SAI Global 2011) defines an excellent organisation as one that; ‘defines its purpose, vision and values for organisational success and ensures it is understood and applied across the organisation’.

How to create shared vision

So, if stakeholder commitment to a shared vision of excellence is critical to organisational wellbeing, how do we make it happen?

Christie Downs Primary School in South Australia has done so – to great effect! The school, of 270 students, includes 90 learners with special needs supported by an integrated Disability Unit. The current school was established four years ago through the merging of two sites, an existing primary and special school. Two different cultures and organisations needed to come together to work as one. The school engaged key stakeholders in creating a shared school vision. The vision would also inform the new school’s four-year strategic plan.

Every student and staff member took part in at least one of a series of workshops to provide their ideas. Parents, families and other community members were invited to attend either a student or after hours workshop to have their say. Students with special needs were interviewed using creative one-on-one techniques that gave them a ‘voice’. Stakeholder input was then collated and a vision drafted by a team comprising students, parents and staff. Students were allowed to lead the team to ensure the crafting of a simple, jargon-free, to-the-point guiding statement. The resulting draft was communicated to all stakeholders, agreed, and used to inform the school strategic plan.

The vision has guided improvement activity and decision-making across the school for the last four years. Leadership and staff attribute the positive culture the school enjoys today to the ownership and commitment generated through this visioning process.

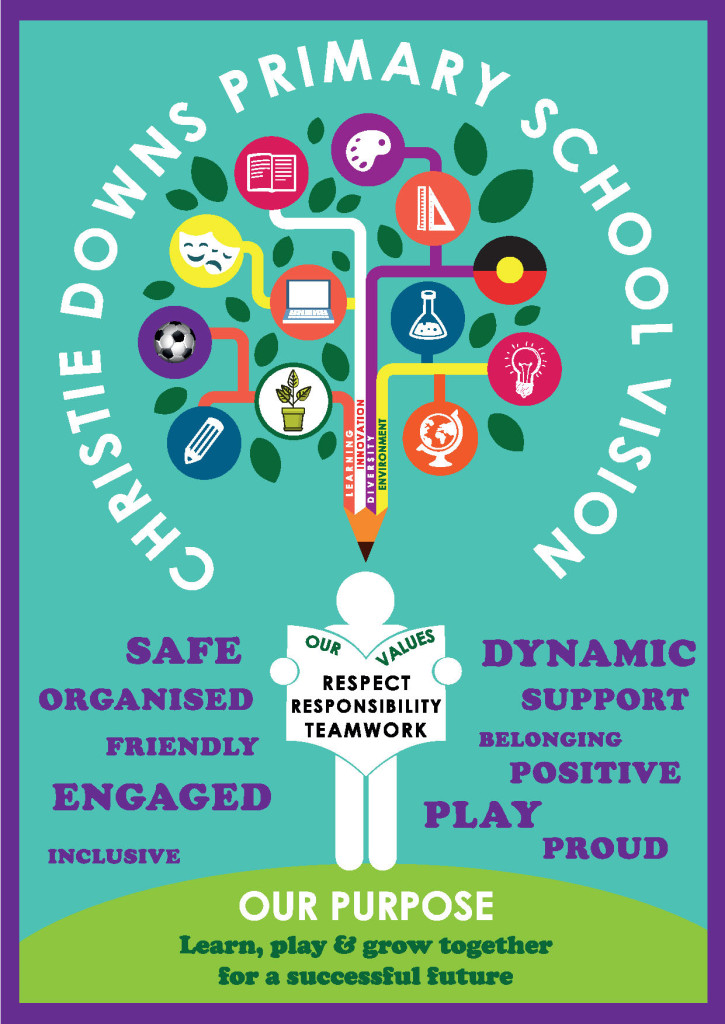
Earlier this year, the fourth in the school’s planning cycle, stakeholders were invited to reflect on achievements and again have input to the school vision to inform the next strategic plan. A refined school purpose, values and behaviours, and graduate profile were also agreed. The process was very similar to that used four years previously with all students, staff and families inputting their ideas. However, this time the school team (again comprising students, parents and staff) chose to summarise and communicate the revised school direction by way of an image: that of a tree (pictured below).

Christie Downs Primary School Vision

All stakeholders are really excited about their tree metaphor!  The tree roots are the school’s purpose. The supporting trunk of the tree are the key elements of the school vision – ‘learning, innovation, diversity, and environment’, these underpin the strategies of the school plan. The values of the school are in the hands of the stakeholder who stands beneath the tree branches and leaves – the graduate profile – the skills and capacities, attitudes and behaviours developed by the students of the school.

Congratulations Christie Downs!

So what is different about this approach?

This collaborative process:

  • involves all key stakeholders of the school community – everyone has a ‘voice’
  • celebrates diversity, allowing for a richness of ideas to flourish (this is not possible when only a few in the organisation are involved)
  • builds shared understanding, ownership and commitment.

To learn more about creating shared vision…

Watch a video

Purchase a QLA System Mapping Guide

Read our forthcoming book ‘Improving Learning: A how to guide for school improvement’.

School purpose and vision: how stakeholder perspectives differ

Students, teachers and families usually have different perspectives regarding the purpose and vision for their school.

Over the years, we worked with families, staff and students at dozens of schools, to identify their aspirations and agree the purpose and vision for their school. This builds a shared direction, ownership and commitment to the school. It also provides a point of reference to inform planning and decision-making into the future.

The process usually involves working with each group to identify and prioritise their views on the elements that comprise purpose and desired vision for the school.

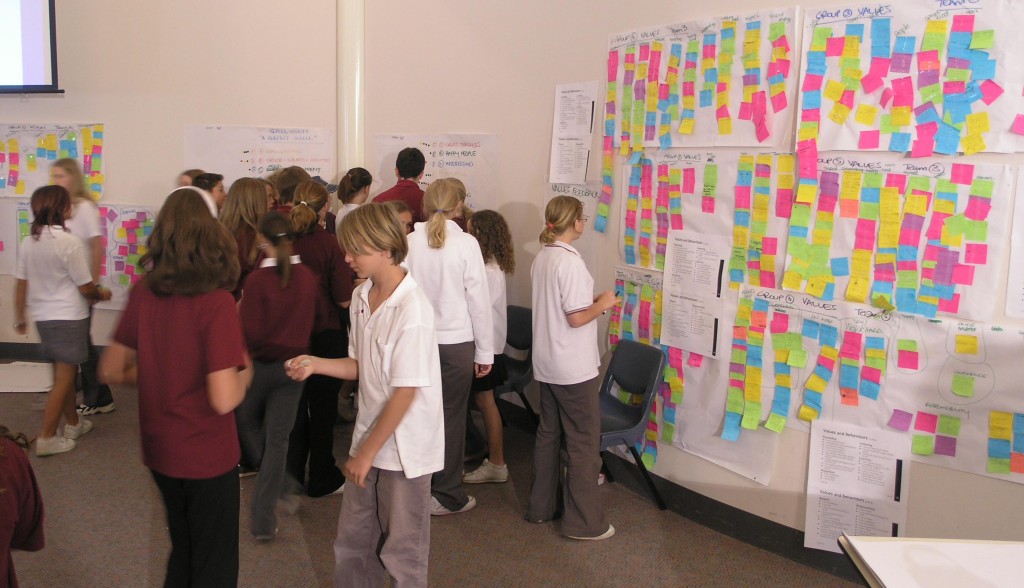
Students prioritising the proposed school values
Students at Seaford 6-12 School, South Australia, prioritising the school values

Every school is unique. Consequently, the stated purpose and vision tend to be unique to each school. There are common themes too.

Common themes

A review of data from several Australian schools, with whom we have worked, reveals the following common themes: identified by families, students and staff. (These schools represented a mix of primary and secondary schools across four states and territories.)

  • A place of pride
  • Choice of subjects
  • Clean
  • Curriculum
  • Engaged students
  • Focus on the ‘whole child’
  • Friends
  • Fun
  • Good academic results
  • Great resources
  • Great teachers
  • Passion for learning
  • Pedagogy
  • Positive school spirit
  • Respectful and supportive
  • Safe and happy
  • Students future ready
  • Students learn how to learn
  • Technology

The majority of schools referred to each of these themes. The wording, expression or nuance may have varied from school to school, but in essence these themes were common.

Different Perspectives

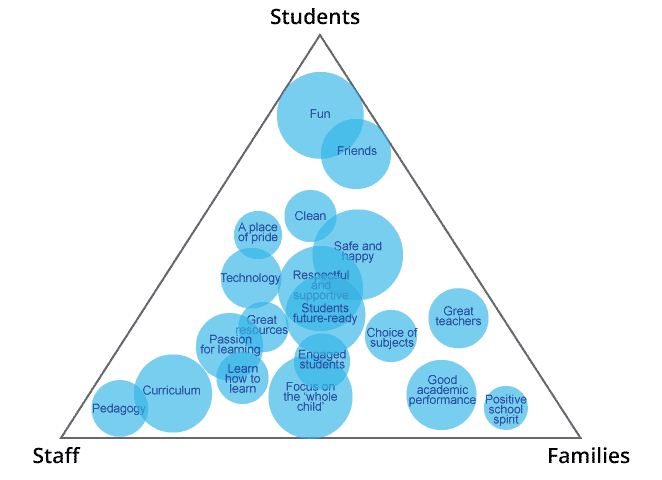
Of particular interest is the degree to which each stakeholder group raises these themes. Some themes, such as Safe and happy, Respectful and supportive and Students future ready are referred to by all three stakeholder groups in roughly equal measure. Other items tend to be raised by only one group. Typically only students identify Fun and Friends as being important elements of their schooling. Similarly, only teachers tend to raise Curriculum and Pedagogy. Other themes are raised by two of the three groups. Students and parents want Great teachers, though the teachers tended not to mention this. Staff and parents want Engaged students, while students tend not to identify this.

The figure below illustrates these different perspectives. Each item is represented by a bubble, the size of which indicates the frequency with which the item is raised; the bigger the bubble the more commonly it is mentioned. The closer the bubble is to one of the three corners (Students, Staff or Parents), the stronger that stakeholder expression of that item. For example, that only students mention Fun is indicated by it being tight in the Students’ corner. Alternatively, Respectful and supportive sits in the centre of the triangle, indicating it was identified by students, staff and parents in equal proportion.

Key messages

We believe these finding illustrate two important points.

Firstly, they highlight the importance of taking the time to find out the perspectives of each stakeholder group, directly from that stakeholder group. Attempts to second-guess the perspective of another group are very likely to completely miss entire themes held dear to that group. Involving each stakeholder group in the development of a shared direction or System Map is a great way to start.

Secondly, there are many points of commonality among these stakeholders, which provide the basis for agreement. Each group mentioned most themes, at least to some degree. This commonality provides a starting point for generating and documenting a shared perspective that is agreeable to all stakeholder groups. Furthermore, once the unique perspectives of individual groups are identified these can be discussed and are frequently incorporated into the new shared perspective.

Discussion

What are the common views among your stakeholders? What are the differences? How do you know? How do you manage the difference?

What the school improvement gurus are not yet talking about

Over the past 15 years the conversations about school improvement have been changing.

Key observations about school improvement, which were not discussed at the turn of the millennium, are now clearly on the agenda.

However, there are still critical elements that are not yet part of this dialogue. This post reflects upon these important conversations.

What is being talked about

Items now on the agenda include:

  • The systemic nature of school systems. There is growing awareness of the interconnectedness that exists among the component parts of these complex social systems. These components need to work together if the system is to be optimised towards its aim.
  • Students’ learning as the aim, rather than teachers’ teaching. This may seem a pedantic distinction, yet it profoundly changes the emphasis in dialogue, and thereby the focus of improvement efforts: from educational policy right through to the classroom.
  • Our systems of school education are not meeting the needs of significant proportion of students. Not only is the system failing our more disadvantaged students, dissatisfaction is widespread and evident in the perceptions of students, teachers and families. Furthermore, in Australia at least, the performance of the education system has largely flat-lined over the past decade, in spite of significantly increased resources. There are pockets of excellence and dramatic improvement, but across the system improvement progress is glacial.
  • The use of data to inform improvement. With the development of national testing in Australia, and elsewhere, there is now systemic learning data that stimulates and informs conversations and debate. Like it or not, these data are here to stay, and they continue to inform the debate about school improvement.

The organisational improvement theory, derived primarily from the work of Dr. W Edwards Deming, leads directly to each of these observations. They have been part of our conversations with friends, clients and colleagues for over a decade. We are encouraged that the significance of these issues and opportunities is now recognised.

What is yet to be talked about

Improvement theory also points to other key opportunities that are not yet common in dialogue about school improvement.

Student contribution to school improvement

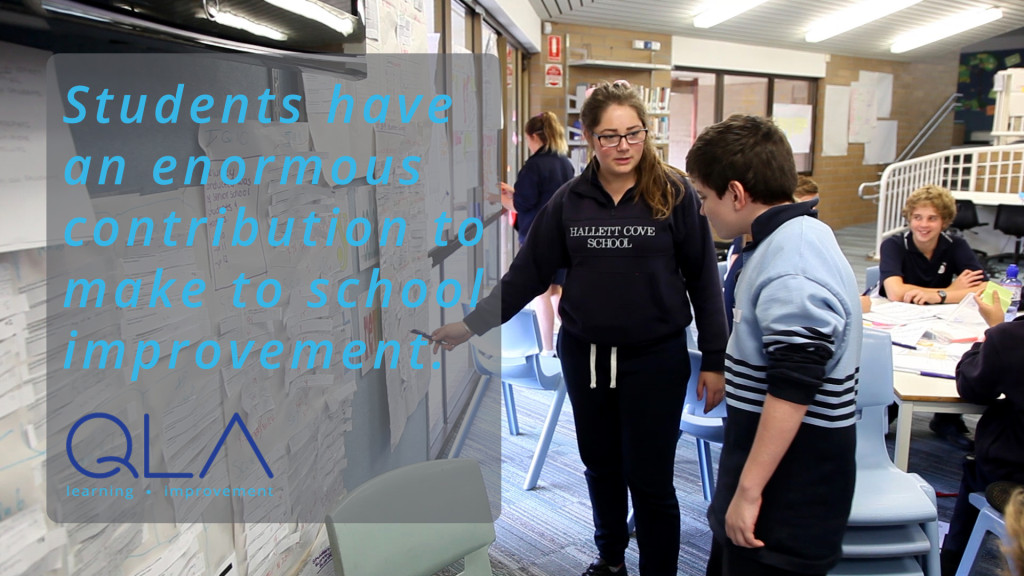
Students have an enormous contribution to make to school improvement.
Students have a lot to contribute

It is only students who truly know what helps and hinders their learning.

Unless their insight is accessed, acknowledged and acted upon, attempts to improve learning are likely to be misguided. Furthermore, if all students are to benefit, this action needs to be taken regularly at the local level, in each and every classroom. Simple tools, such as the Parking Lot and Force-field Analysis, provide mechanisms that enable this from pre-school to senior high school levels.

Students can contribute significantly to improving the operation of the school.

Some schools emphasise ‘student voice’ through mechanisms such as Student Representative Councils and Student Leaders. These process, while important, are in no way sufficient. A much greater opportunity lies in having students skilled and experienced in leading and participating in improvement project teams. These teams can apply the Plan-Do-Study-Act learning cycle to directly address opportunities to improve the school. Not only does this approach build the capability of students to personally contribute to improvement (a capability that can be of great benefit to them in their future), it also builds student ownership of the school and classroom while relieving the burden on school leaders, administrators and teachers.

Too much what, not enough how

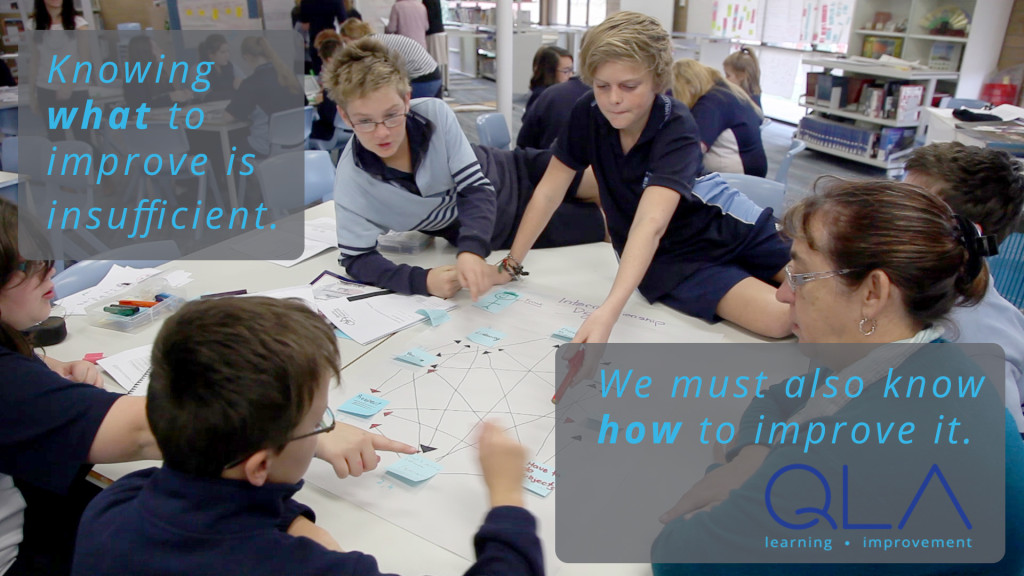
Knowing what to improve is insufficient. We must also know how to improve it.


There is far too much discussion of what excellence in schools looks like, at the expense of how schools might achieve it.

Knowing what to improve is not sufficient. We must also know how to improve it. Copying others’ examples of good practice rarely delivers sustainable improvement. Schools can learn from others’ good practice, but each school must develop and test its own theory for improvement. The Plan-Do-Study-Act improvement cycle and the associated Quality Learning tools provide the ‘how to’ for developing and testing a theory for improvement.

These two observations, which remain to be discovered by leaders of the school improvement movement, hold the most significant promise for delivering demonstrable and continual school improvement.

Note: Our thanks to Hallett Cove R-12 School, South Australia, for the images, which were taken during QLA facilitated Student Improvement Team workshops in 2014.

Discussion

We would love to hear your views on this topic. What do you see missing from the dialogue about school improvement?