Quotes

PE, PDSA and Student Voice

We have previously discussed the power of the Plan-Do-Study-Act (PDSA) cycle in bringing about collaborative, sustainable improvement. We have also emphasised the importance of allowing students to play a key role – giving students a ‘real voice’ – in improving their school and classroom. In this blog, we share another example. This time, how the PDSA process was used by a teacher and students to improve learning and engagement in their physical education (PE) classroom. (You can also view this as a QLA case study video.)

Chris, PE Teacher
Teacher, Chris, with her PE class PDSA storyboard

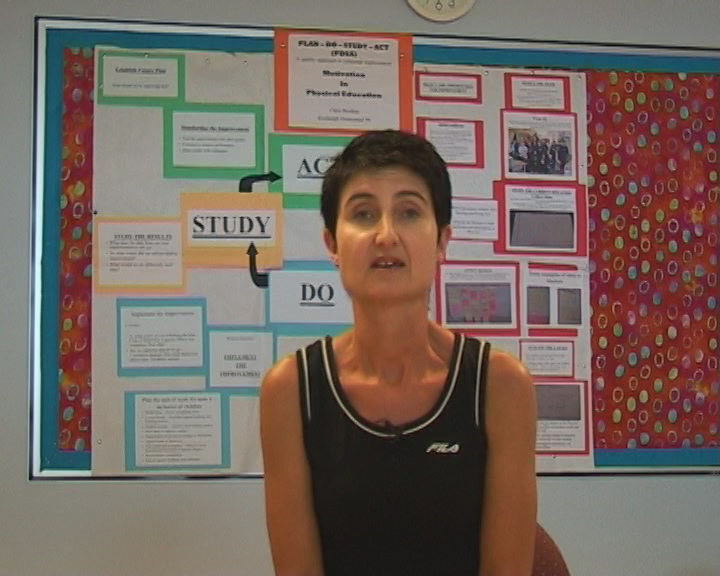
Chris is a leading specialist teacher at a Victorian primary school. She observed the school’s Year 6 students becoming increasingly disengaged during their weekly PE lessons. PE teachers were stressed and student behaviour was worsening. No one was enjoying PE!

Chris decided it was time to set students and teachers to work to improve PE by applying the PDSA cycle.

As we have seen previously:

PDSA is a highly effective improvement approach, based upon a cycle of theory, prediction, observation, and reflection.

It involves applying a structured process to achieve sustainable improvement.
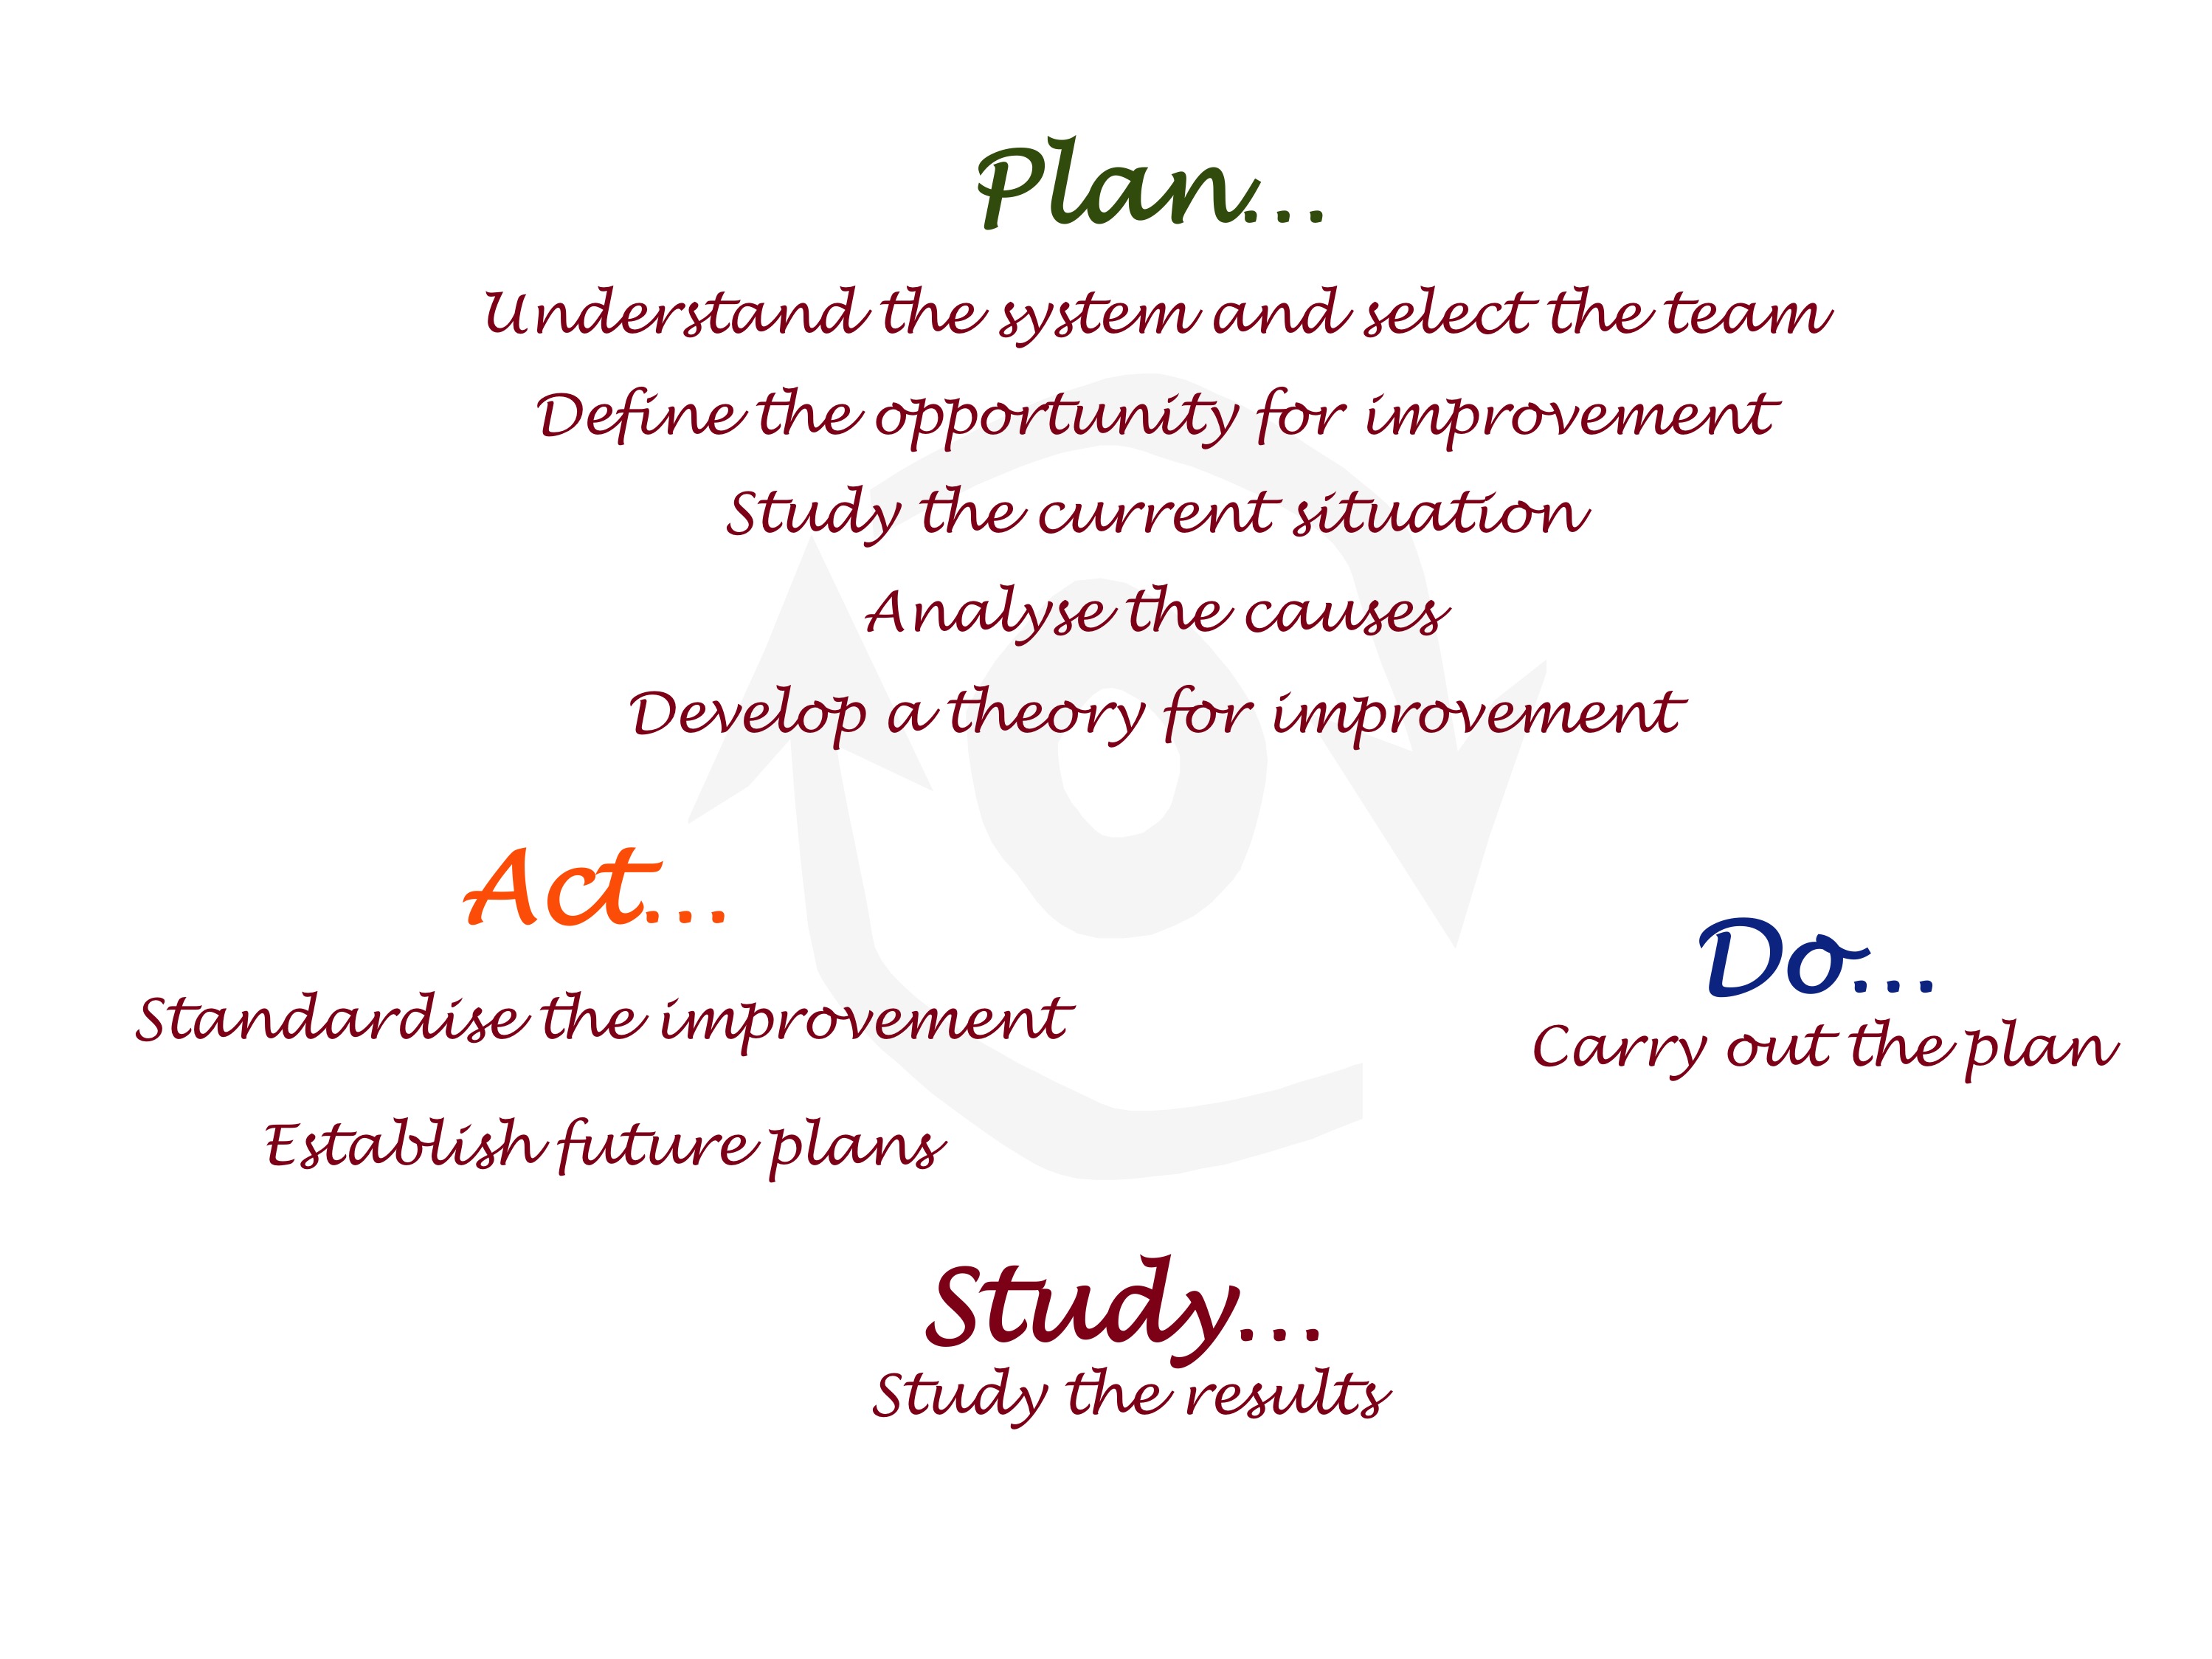
A nine step PDSA process

This includes:

  • defining the opportunity for improvement by agreeing the purpose and establishing a shared vision of excellence
  • focusing improvement efforts on a system or process (rather than blaming individuals)
  • identifying root causes not symptoms
  • developing and applying a theory for improvement
  • reflecting on the outcomes achieved to agree a new ‘best method’ or further improvement needed.

Here’s how…

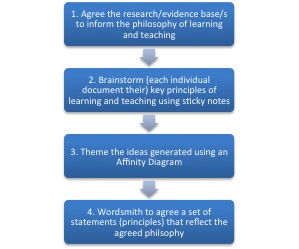
Chris applied the PDSA process with her students. They documented a comprehensive storyboard to capture their agreements, the data collected, and to reflect their progress in applying the PDSA process.

Here’s what they did:

  1. Students and teachers discussed to agree the opportunity for improvement – to improve their PE classes.
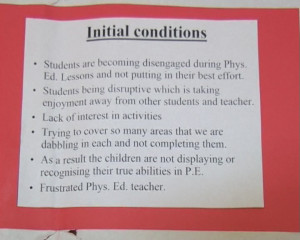
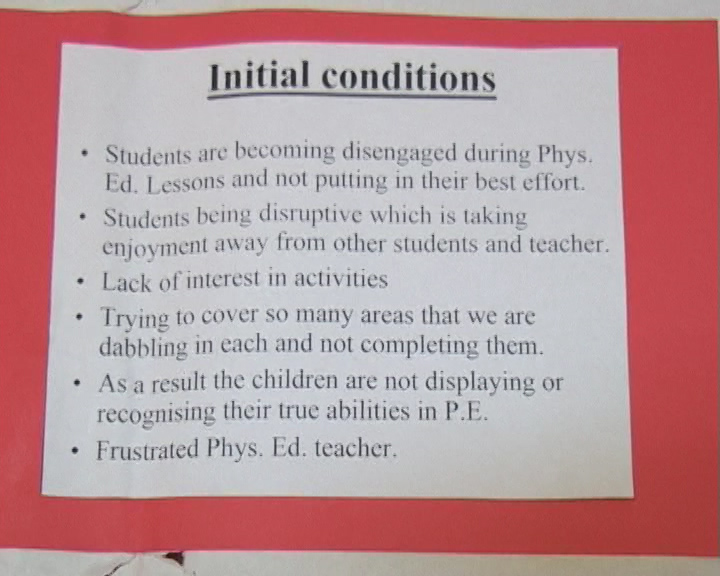
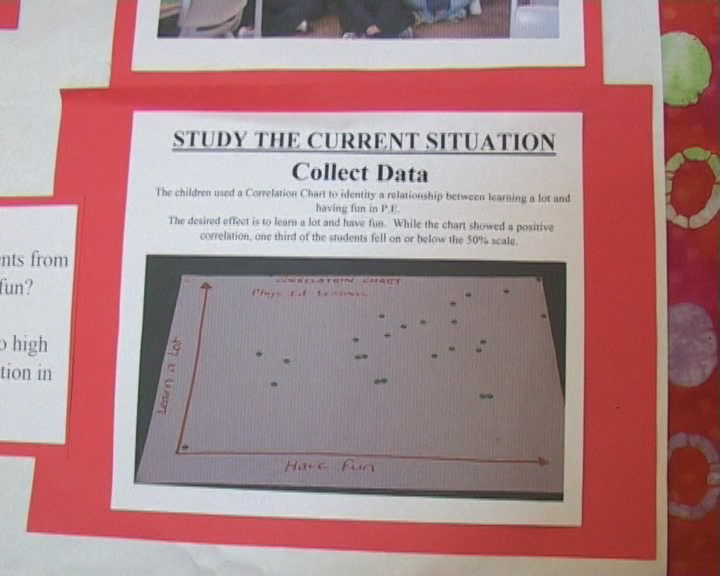
  2. They studied the current situation – what did PE currently look like, feel like, and what was going on? They agreed: students were disengaged, disinterested and not putting in their best efforts; some students were disrupting the class, preventing others from enjoying PE; and teachers were frustrated.

    CSV014f RHPS PDSA PE.00_00_54_14.Still001
    PDSA storyboard extract: brainstorm of the current situation in PE
  3. They collected data to measure the extent of the dissatisfaction with PE. A correlation chart was used to measure student
    CSV014f RHPS PDSA PE.00_01_30_08.Still002
    PDSA storyboard extract: collecting data using a correlation chart – how much are students enjoying and learning in PE?

    perception. The data revealed low levels of student enjoyment
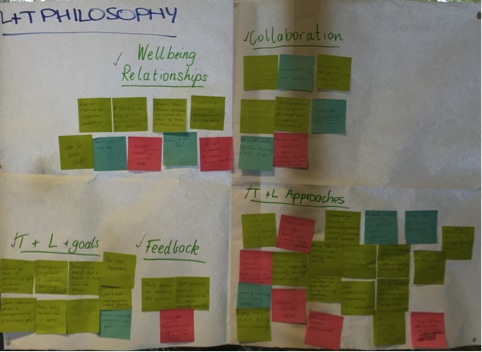
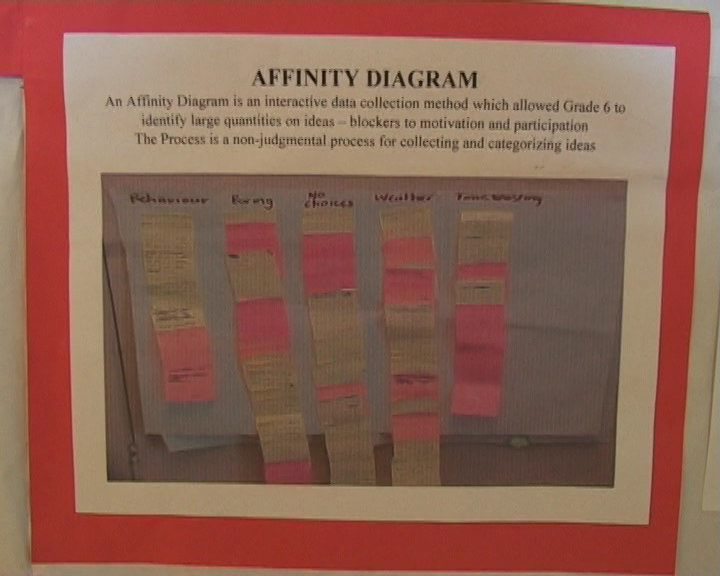
    (fun) and learning in the PE classroom.

  4. Students then brainstormed and themed the drivers and barriers associated with motivation and participation in their PE classroom. They used sticky notes and an affinity diagram to facilitate this. The major barriers they identified were: ‘inappropriate behaviour’, ‘boring classes’, ‘lack of student choice’, ‘the weather’ and ‘wasting time’.

    CSV014f RHPS PDSA PE.00_01_43_07.Still003
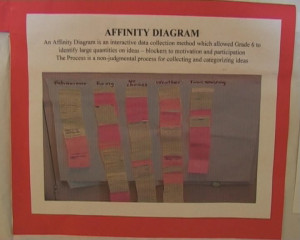
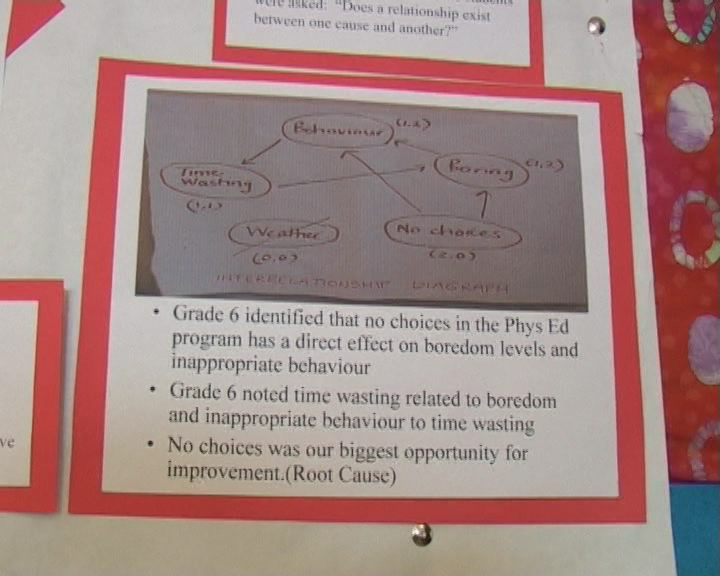
    PDSA storyboard extract: affinity diagram of the barriers to student motivation and participation in PE
  5. These barriers were analysed to agree the root causes using an interrelationship digraph. (They knew that by working on the root causes of their problem that they would realise the greatest return on their improvement efforts.) For the PE students this revealed ‘lack of choice’ as the major or root cause. A lack of choice by students in their PE lessons was seen as a major barrier to participation and motivation. It was impacting upon the other causes and driving the observed problems with behaviour and performance in their classroom.

    CSV014f RHPS PDSA PE.00_02_21_16.Still004
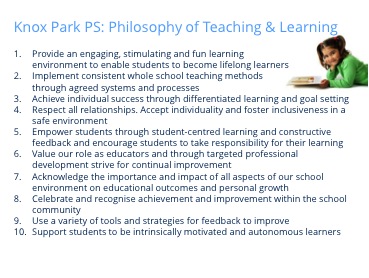
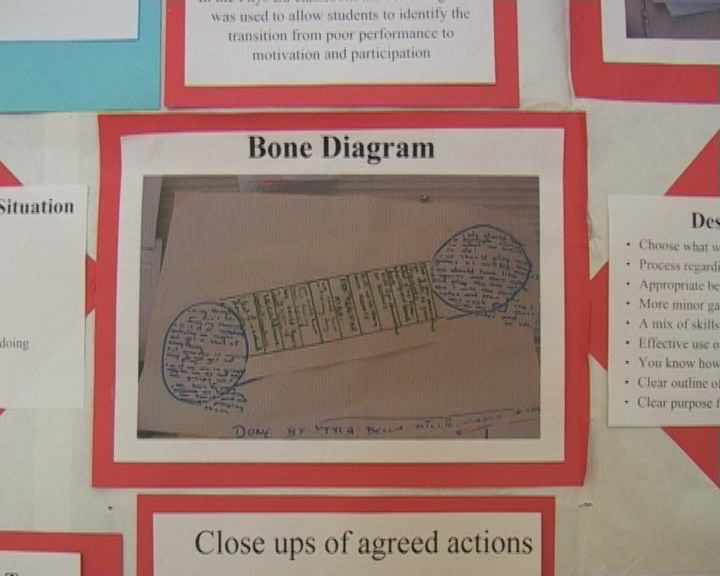
    PDSA storyboard extract: interrelationship digraph analysing the root causes of a lack of student motivation and participation in PE
  6. A bone diagram was used with students to further explore the current situation, and to agree a vision of excellence for PE – what they wanted PE to be like. The resulting student vision showed students believed: student choice, a clear purpose and process for each session, appropriate behaviour, more minor games, a mix of skills, effective use of time, student’s understanding what was expected, and knowing whether they were improving; were the key characteristics students believed were essential for a great PE lesson.

    CSV014f RHPS PDSA PE.00_02_50_14.Still005
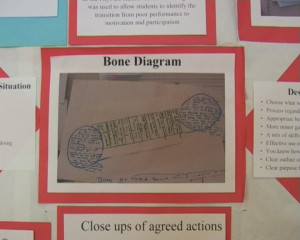
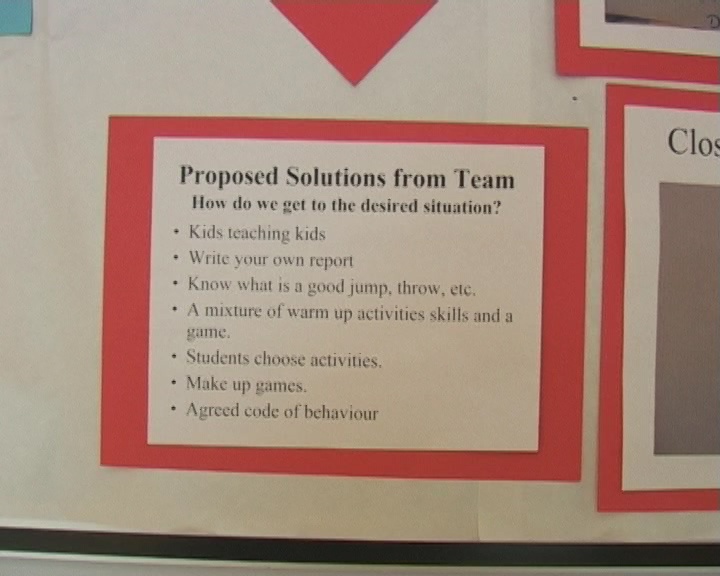
    PDSA storyboard extract: bone diagram agreeing a vision of excellence for PE
  7. They brainstormed possible solutions which included: ‘kids teaching kids’,  students ‘choosing activities’ and ‘writing their own report’,   agreeing a student ‘code of behaviour’, clarifying expectations (quality criteria: ‘know what a good throw, jump looks like’), and students ‘making up games’.

    CSV014f RHPS PDSA PE.00_03_29_13.Still007
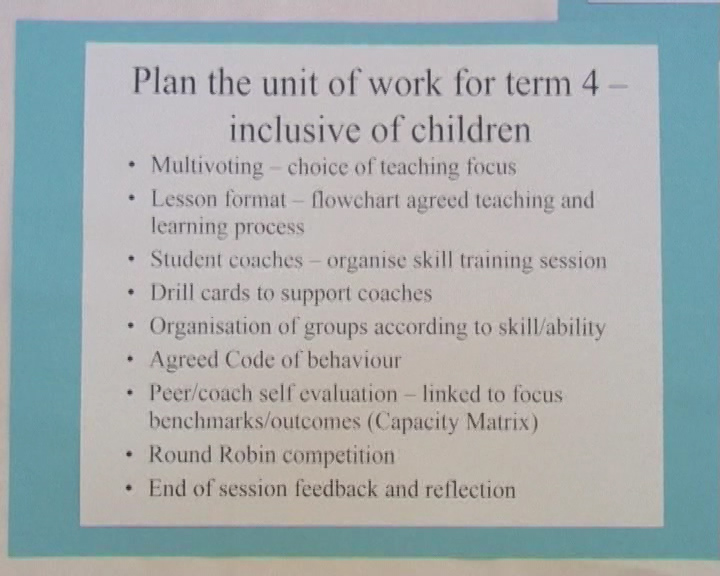
    PDSA storyboard extract: brainstorm of possible solutions to improve PE
  8. These solutions helped them to develop a ‘theory for improvement’ comprising the following key strategies:
  • multi-voting to agree the focus of each lesson
  • agreeing the lesson format – flowcharting the teaching and learning process
  • appointing student skill coaches and documenting skill cards to help the coaches do their job
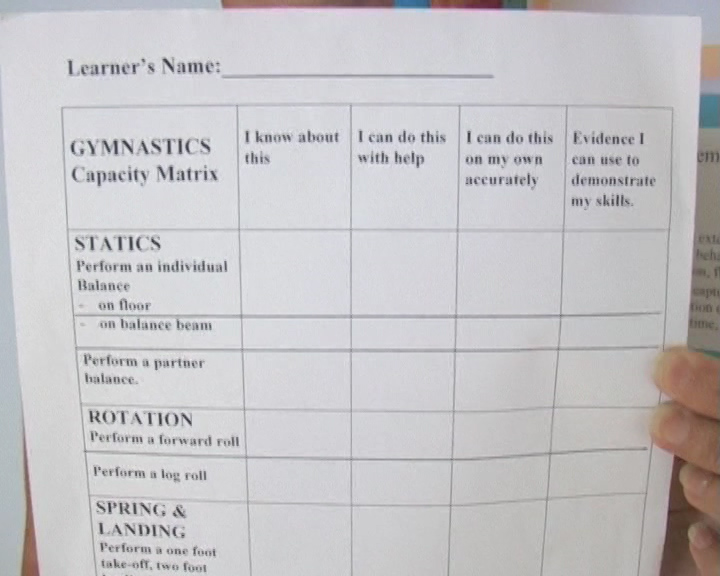
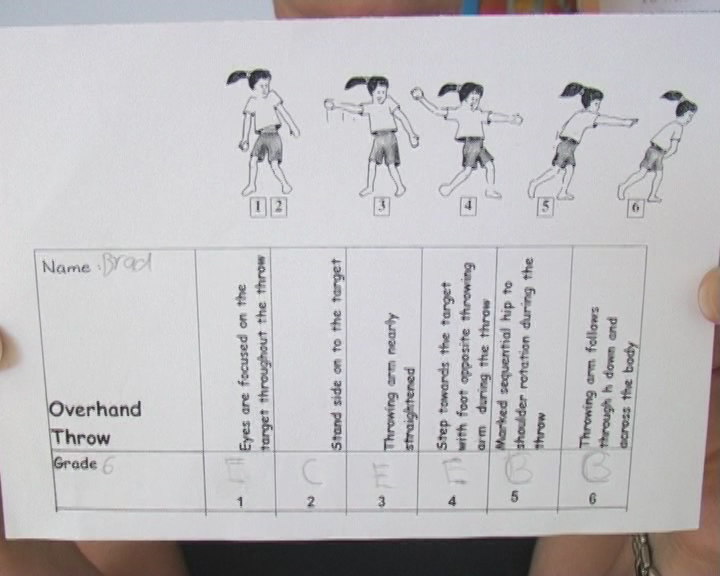
  • students undertaking peer evaluation together with their teacher/coach. They developed capacity matrices for key areas of learning to help them to do this. They also documented quality criteria describing how to execute essential skills with a high degree of excellence (e.g. how to do an overhand throw). Students used the capacity matrices and quality criteria as the basis for reflection and evaluating their progress in PE
  • agreeing a code of behaviour
  • everyone reflecting and giving feedback after each lesson.
CSV014f RHPS PDSA PE.00_03_46_16.Still008
PDSA storyboard extract: agreed strategies to improve PE
CSV014f RHPS PDSA PE.00_04_32_02.Still010
PE – capacity matrix for gymnastics
CSV014f RHPS PDSA PE.00_04_48_15.Still012
PE – quality criteria for an overhand throw

The outcome?

The PE classes applied the agreed strategies and new processes, and a few weeks later reflected on the effectiveness of the improvements they had made (the ‘study’ phase of the PDSA
process).

  • Behaviour and engagement improved. Students were motivated and learning
  • Students ‘owned’ and were running the PE lessons with minimal guidance from PE teachers! They were responsible for their learning
  • PE lessons had a productive ’buzz’! Students were excited. Teachers were happy.

The processes they had developed together were adopted as the new way for PE lessons.

Chris described the PDSA based collaborative process as having an amazing impact.

Applying the PDSA process, working ‘with the kids’ and not  ‘doing to the kids’,  brought about significant positive change to PE lessons – improving the way teachers were teaching and students were learning – to great effect!

Learn more…

Download the detailed 9-step PDSA poster.

Purchase IMPROVING LEARNING: A how-to guide for schools, to learn more about the quality improvement philosophy and methods.

Purchase our learning and improvement guide: PDSA Improvement Cycle.

Watch a video of PDSA applied to year one writing.

Watch a video of PDSA applied within a multi-age primary classroom.

Watch a video about student teams applying PDSA to school improvement.

Understanding Variation 1 – common and special cause variation

This is the first in a series of four blog  posts to introduce the underpinning concepts related to variation in systems. In this post we discuss common cause and special cause variation.

These concepts provide a foundation for understanding and responding to variation in systems. In particular these concepts are fundamental to understanding the notions of stability, capability and avoiding tampering; each of which will be discussed in subsequent posts.

We also discuss simple tools that allow us to ‘see the variation’ in systems and processes. Understanding and applying these concepts and tools helps us to respond appropriately to data to continually improve, rather than risk making things worse!

Variation is everywhere

Variation is evident in all systems. No two real things are identical.

Consider, for example, the standard AA size battery. AA size batteries are 50 mm long and 14 mm in diameter, as defined by international standards. They all look the same and are perfectly interchangeable. Yet each individual battery cannot be exactly 50 mm long and exactly 14 mm in diameter. Most people don’t care that one battery is 50.013 mm long and another is 49.957 mm long; both will fit perfectly well in their flashlight or remote control. To detect these differences – the variation – precise measuring equipment is required.

A factory will produce batteries with a length that has a calculable mean, an observable spread, and a clustering of lengths around the mean. All determined by the manufacturing process.

While two observed things are never identical, we can think of them as being identical when our measurement system is unable to detect difference, or when any differences are of no practical significance.

Sometimes variation is more evident. The average height of an Australian 13-year-old boy is approximately 156 cm. Very few 13-year old boys are precisely 156 cm tall, but nearly all will be within about three cm of this average height. This phenomenon is known as the natural limits of variation. In this case; a typical 13 year old boy’s height falls naturally within a range of heights centered at 156 cm and varying up to about three cm above and below this value.

All processes and systems exhibit natural variation. In both these examples, a battery’s dimensions and the height of a 13-year-old boy, the characteristic being measured is different from observation to observation. Yet, as a set of observations they conform to a defined distribution, in this case the normal distribution.

The factors that cause this variation, from observation to observation, come from the system. In the case of AA batteries, it is the system of manufacturing; variation in the height of 13-year-old boys comes from genetic, societal and environmental factors. In both cases, it is the system that produces natural variation.

In a similar manner, systems produce variation in perceptions and performance. Figure 1 shows the perceptions of teachers in a school regarding the degree of engagement of their students. The variation in perceptions is evident.

Consensogram of perceptions of student engagement.
Figure 1. Consensogram of perceptions of student engagement.

It is the system that produces natural variation. To understand this variation, it is necessary to understand the system. No examination of individual examples can explain the system.

Common cause variation

Variation observed in any system comes from diverse and multitudinous possible causes.

The fishbone diagram can be used to document the many possible causes of variation. The fishbone diagram in Figure 2, for example, lists possible causes of variation in student achievement.

Fishbone Possible Causes of Variation in Student Achievement
Figure 2: Fishbone Diagram of Possible Causes of Variation in Student Achievement

Each of the causes affects every student to a greater or lesser degree. Students respond to each cause in different ways, so the impact is different for each student. For example, some students may be sensitive to background noise while others are not. Some students may struggle to balance family responsibilities, work and school, while for others this not an issue. All students will be affected to some degree by their prior learning and their attitude towards the subject matter. The key point, however, is that every student may be affected to some degree by every cause. It is how all of the causes come together for each individual student that results in the variation in student achievement observed across the class. Causes that affect every observation, to greater or lesser degrees, are called common causes.

Common cause variation is the variation inherent in a system. It is always present. It is the net result of many influences, most of which are unknown.

In general, it is the combination of the common causes of variation coming together uniquely for each observation that results in the distribution in the set of data points. That is, the set of observations conform to a defined distribution. Not surprisingly, this distribution is frequently a normal distribution.

Figure 3 shows a histogram or frequency chart of the variation in year 7 students’ reading test scores from an Australian school, as measured by a national standard test. You can see the natural spread of variation in this measure of the students’ reading performance.

Histogram of Reading Results Year 7
Figure 3. Histogram of Reading Results Year 7

For any single data point — for example, a single student’s test result — it is not possible to identify any specific cause that led to the result achieved. Importantly, it is not worth trying to identify any such single cause.

The system of common causes determines the behaviour and performance of the system. These causes include the actions and interactions among the elements of the system, as well as features of the structure of the system and those of the containing systems.

Special cause variation

The other type of variation is special cause variation.

When a cause can be identified as having an outstanding and isolated effect  — such as a student being late to school on the morning of an assessment — this is called special cause variation or assignable cause variation. A specific reason can be assigned to the observed variation.

Special cause variation is variation that is unusual and unpredictable. It can be the result of a unique event or circumstance, which can be attributed to some knowable influence. It is also known as assignable cause variation.

Special causes of variation are identifiable events or situations that produce specific results that are out of the ordinary. These out of the ordinary results may be single points of data beyond the natural limits of variation of the system, or they may be observable patterns or trends in the data.

Figure 4 hows a histogram or frequency chart of the variation in year 7 students’ grammar test scores from the same Australian school, as measured by a national standard test. You can see the natural spread of variation in this measure of the students’ grammar achievement. You can also see one student’s results significantly below the vast majority of scores. That single observation suggests a special cause of variation and is worthy of investigation.

Histogram of Grammar Results Year 7
Figure 4. Histogram of Grammar Results Year 7

Where there is evidence of special cause variation in a set of data, it is always worth investigating. The impact of a special cause may be detrimental, in which case it may be appropriate to seek to prevent occurrence of this cause within the system. The impact of a special cause may also be beneficial, in which case it may be worth pursuing how this cause can be harnessed to improve system performance.

Special causes provide opportunities to learn. The lesson might be as mundane as “that batch of electrolyte was contaminated”, or it might be as exciting as the discovery of penicillin, or a new strategy for learning.

In summary:

Variation is evident in all observations – from physical dimensions to student behaviour and academic achievement. Most observed variation is due to common causes – those causes that affect every observation, to differing degrees. Sometime, there are specific and identifiable causes of variation – these are known as special causes.

These two key concepts – common and special cause variation – are fundamental to responding to system variation appropriately. An understanding of these concepts is critical to affecting demonstrable and sustainable improvement. They underpin an understanding of system stability, capability and tampering, which will each be discussed in future blog posts. Where these concepts are not understood, attempts to improve performance frequently make things worse.

Download a Fishbone Diagram template.

Read about Four types of measures, and why you need them.

Read more in our comprehensive resource, IMPROVING LEARNING: A how-to guide for school improvement.

Purchase our learning and improvement guide: Using data to improve.

What is your school’s learning theory?

What is your school’s theory of teaching and  learning?

Some schools waste time focusing their efforts on trying to control and manage the actions and behaviours of individuals. They would do better examining the underpinning theory, systems and processes driving the action and behaviour. Reflecting deeply on, and defining (making explicit), the beliefs upon which current approaches to learning and teaching are based, can lead to great focus, alignment and return on efforts to improve.

Fundamental to improving learning is to agree (define) the theory guiding our teaching and learning.

The following anthropological model adapted from the work of Martin Weisbord can help us understand why this is so. It describes a hierarchy of influences on organisational behaviour. The model is consistent with Deming’s teachings on how systems drive performance and behaviour, and the need to develop theory to drive improvement.

Weisbords Ladder
Weisbord’s anthropological model illustrating an organisational heirachy of theory driving action and behaviour

Weisbord’s model illustrates the relationship between beliefs, philosophy (theory), systems, processes, choices and action. An organisation’s systems and processes reflect and reinforce its values, beliefs and philosophy. These systems and structures dictate the processes and methods, and shape the dilemmas and choices faced by individuals of the organisation. The choices made by individuals, in turn, produce the actions and behaviours we observe.

Let’s look at an example to illustrate. Say we believe students are inherently lazy, that they have little desire to improve, and need to be motivated to learn. We will then develop systems and processes in our school and classrooms in an attempt to extrinsically motivate them. Our systems and processes will usually be based upon incentives and rewards, fear and punishment. If, however we believe we are born with an innate desire to learn and to better ourselves, and that the motivation to learn comes from within, then we will design very different systems of learning in our classrooms. These systems usually focus upon building ownership of learning, and working with students to identify and remove the barriers to their intrinsic motivation and learning.

Defining a theory and designing systems and processes can be a deliberate and thoughtful action or it can occur through natural evolution – the choice is ours.

We can make a conscious choice to define and make explicit our values and beliefs regarding teaching and learning.  An operational definition is used to achieve and document a shared understanding of the precise meaning of concept/s. Operational definitions provide clarity to groups of individuals for the purposes of discussion and action.

It follows that once we have defined our theory of teaching and learning, we can design structures, systems, processes and methods that are aligned to it and naturally promote the actions and behaviours we desire.

Of course, we draw upon evidence-based research to craft our theory. We can then work together over time testing, reinforming and reaffirming this theory, and improving systems and processes to produce the performance and behavioural outcomes we wish to see.

How to…

Our work with schools in defining a learning and teaching philosophy has typically followed the process summarised in the flowchart below. All staff are invited to be involved in agreeing the philosophy which takes place through one or more workshops.

Developing a Learning Theory Flowchart
Flowchart of a process to create a school learning theory

Step 1.  Agree a research or evidence-base to inform the philosophy

The first step is to agree and draw upon a research or evidence-base to inform the philosophy. Education systems in Australia have, over time, adopted different pedagogical models. Schools have adopted many different models, all purporting to reflect the latest research and providing the theory necessary to guide excellent teaching practice. The Quality Teaching model, the National School Improvement Tool, the e5 Instructional Model, and the International Baccalaureate are examples of pedagogical models currently in use. Explore the preferred model/s with all staff before defining your philosophy to agree which one or more resonate and align with the needs of your learning community. Of course, if there is a model that adequately describes the philosophy to teaching and learning that your school community wishes to adopt, the job is made easier. Job done – just agree to use it!

Step 2.  Brainstorm ideas

Something we tend to overlook is to recognise the ‘prior knowledge’ of our teachers. Every educator will have developed a theory – based upon their understanding and experience – as to the greatest influences on learning in their classroom. Ask staff also to reflect upon their own teaching and learning values and beliefs. We have found it helpful to express the learning and teaching philosophy as a set of (documented) principles.

To define the philosophy, ask staff to brainstorm their key learning and teaching beliefs, concepts and principles. This can be achieved by every staff member providing their input to the process by writing down their individual ideas as statements on sticky notes – one statement per sticky note.

Step 3.  Collate the ideas using an Affinity Diagram

The staff input can then be collated by creating an Affinity Diagram with the sticky notes. Headings are applied to the Affinity Diagram reflecting the agreed major themes (as in the figure below).

Learning Theory Affinity Diagram
Affinity Diagram – theming ideas for a learning theory

Step 4.  Agree theory statements

These themes can be documented as a set of agreed statements (principles). For example, the following are the principles of learning and teaching agreed to by Knox Primary School in Melbourne, Victoria.

Knox Park Primary School, Victoria Learning and Teaching Philosophy

Here is another example of an agreed learning and teaching philosophy. It is the Learning Model developed by the Leander Independent Schools District in Texas, USA.

LISD Learning Model
Leander Independent Schools District, Texas, USA Learning Model

The theory as a foundation for continual improvement

The school’s theory of learning and teaching, or principles, are then used as an ongoing reference to develop, review and continually improve consistency in policy and practice across the school. Each principle is subject to ongoing exploration through reflection and dialogue to develop deeper and shared understanding, and to inform the development of agreed learning systems and processes – the school’s pedagogical framework.

Naturally, the philosophy is dynamic. Like any theory or hypothesis, to be relevant and effective in an ongoing way, it will need to be regularly reviewed, reaffirmed or reinformed by further research and our experiences of applying it over time.

A final note

John Hattie’s research (Teachers Make a Difference: What is the research evidence? Australian Council for Educational Research, October 2003) revealed greater variation between the classrooms in an Australian school than between Australian schools. Defining the theory that will guide teaching and learning across your school is a way to reduce this variation.

To learn more…

Purchase a copy of Improving Learning: a how to guide to school improvement.

Using ADRI during school self-assessment

Using ADRI during school self-assessment

The assessment dimensions of Approach-Deployment-Results-Improvement (ADRI) can be very helpful for self-assessment. ADRI provides a structure under which the activities and results of an organisation can be broken down to identify, quite specifically, where the strengths and opportunities for improvement may lie.

ADRI provides a structured approach to organisational self-assessment. The ADRI dimensions help you to analyse how your organisation goes about: thinking and planning (Approach); implementing and doing (Deployment); monitoring and evaluating (Results); and reviewing and improving (Improvement).

It is a feature of the Australian Business Excellence framework and underpins many other performance excellence frameworks around the world.

ADRI Review Process
ADRI Review Process Poster for Self-assessment

Source: Adapted by QLA from the Australian Business Excellence Framework, the Malcolm Baldrige National Quality Awards Criteria and the European Foundation for Quality Management Excellence Model.

The ADRI assessment dimensions

Approach

Approach relates to the thinking and planning behind the area of endeavour – how it has been designed.

Considering an Approach leads to an examination of:

  • clarity of purpose
  • clients, key stakeholders and their respective needs
  • desired outcomes – the vision of excellence
  • design of strategies, structures and processes to meet the desired outcomes
  • identification of measures of success.

In most organisations the senior leaders, sometimes with the support of content specialists, determine the approach.

For example, senior leaders of a school, frequently with the help of a specialist curriculum committee, usually lead the approach to curriculum. It is the responsibility of these leaders to identify and make clear the purpose of curriculum in the school, the desired curriculum outcomes for the school, and to understand the needs of key stakeholders (including teachers, families and curriculum regulatory bodies). Armed with this understanding, the structures and processes (including documentation) necessary to meet the intentions of the school can be designed. It is during the design stage that the measures of success are also determined from the desired outcomes (the vision of excellence): what data will be used to monitor progress over time? Senior leaders do the thinking and planning – the design.

Deployment

Deployment relates to implementing and doing – how the design is put into effect.

Considering Deployment leads to an examination of:

  • the degree to which the designed strategies, structures and processes have been implemented across the organisation and down through the organisation
  • the extent to which staff understand and have embraced the organisation’s approach
  • how well the strategies, structures and processes have been integrated into the day-to-day operation of the organisation.

Those doing the daily work know most about how the daily work is done. Those that are expected to implement an organisation’s approach know most about it has been deployed. The school curriculum committee may have designed an excellent approach, but it is up to each classroom teacher to implement it. If classroom teachers are not adhering to the agreed school curriculum approach, it has not been deployed well.

Results

Results relates to monitoring and evaluating – how success is gauged.

Considering the Results dimension leads to an examination of:

  • how performance is monitored
  • how the data relating to the measures of success (determined as part of the Approach) are collected, collated and reported
  • the degree to which trends of improvement are evident in these data.

Monitoring and evaluating is a management responsibility. School leaders are responsible for monitoring and evaluating the data used as measures of success for their approach to curriculum. Unless these data are collected, collated and reported, the effectiveness of the approach and its deployment will be unknown.

Improvement

Improvement relates to the processes of reviewing and improving the approach and its deployment.

Considering the Improvement dimension leads to an examination of:

  • the process by which the appropriateness and effectiveness of the approach and its deployment are reviewed
  • how these reviews have led to improvement
  • how the lessons learned are captured and shared.

Improvement is a management responsibility. Continuing the school curriculum example, a school’s senior leaders are expected to regularly review and refine the school’s curriculum. This assessment dimension examines the process by which that is undertaken, the improvements that have resulted and how these improvements are documented and shared with staff and other key stakeholders.

Why ADRI is useful

The assessment dimensions are useful for two purposes: diagnosis and design.

Diagnosis

When something is not working well in an organisation, ADRI provides a lens for examining activities and results to determine why it isn’t working and then to determine what to do about it.

When things aren’t going well, it could be because:

  1. the Approach is weak
  2. the Deployment is poor.

If the approach is weak, attention must be paid to reviewing and improving the design. Deploying a poor approach will not deliver good results.

A sound approach, poorly deployed, will not deliver good results either. If the approach is well thought through but is not being applied, then attention needs to be paid to ensuring people know about and implement the agreed approach.

Note that these two causes – a weak approach and poor deployment – have the same effect: disappointing results. Yet the actions required to address the disappointing results are quite different. ADRI can assist in determining which cause is more significant.

For example, a school may identify parent dissatisfaction with student reports. Firstly, knowledge of ADRI would lead the school leadership team to seek clarity and reflect upon the school’s design for assessment and reporting. Which assessments are to be undertaken? What is the schedule? What is the agreed process for reporting? Is the approach appropriate? These are questions regarding the approach. Secondly, they would explore the extent to which the approach is being applied in practice. Do staff understand and follow the agreed procedures? Are timelines being met? These are questions regarding deployment. Actions required to address parent dissatisfaction will be quite different depending where the opportunities for improvement lie: in the approach, or more to do with deployment.

Design

ADRI is also useful when designing organisation’s systems, structures and processes. In thinking about how to pursue any area of endeavour, ADRI provides useful guidance to ensure key considerations are not overlooked. If you look back over the considerations associated with each of the dimensions, you can easily identify key questions to be answered when determining how to design processes that will achieve an organisation’s goals. These questions could include:

  • Have we clearly articulated our purpose, desired outcomes and a vision of excellence?
  • What are the needs of our clients and key stakeholders?
  • What strategies, structures and processes are required to achieve our aspirations?
  • What data do we need to measure effectiveness and track progress over time? How will these data be collected, collated and regularly reported?
  • How will we document, train and coach people to adopt the new approach?
  • How will we monitor the acceptance and application of the new approach?
  • How will ongoing performance data be monitored and evaluated?
  • What is the cycle of review and improvement for this approach and its deployment?

How to use ADRI

The assessment dimensions of ADRI can be used in many ways. Typically, they are used as:

  1. a checklist for reflecting upon the activities and results of an organisation
  2. a framework for describing the activities and results of an organisation
  3. an assessment model to evaluate the activities and results of an organisation.

ADRI is commonly used as a checklist to think about what is happening in an organisation. For example, thinking about whether observed difficulties are due to a deficient approach or poor deployment is a common application.

ADRI can provide a structure for describing how an organisation goes about its business. This use of ADRI is common in performance excellence awards processes such as those based on the Australian Business Excellence Awards, the Malcolm Baldrige National Quality Awards in the USA, and those of the European Foundation for Quality Management. Organisations describe explicitly how they go about each assessment dimension for each area of endeavour. The areas described are usually the categories or items of these specific frameworks (for example, Leadership, Strategy and Planning, Customers and Other Stakeholders). The use of ADRI in this way is applicable to any area of organisational activity.

A school (or district) could use ADRI as a structure to describe any program, initiative, project or other area of endeavour. For example; a district could document its thinking and planning (approach) to community engagement, how that has been implemented across the district (deployment), how data demonstrate effectiveness in community engagement (results), and the process by which the district reviews and improves community engagement (improvement). The act of documenting the activities and results in this structure usually leads to the identification of strengths and areas of opportunity for improvement.

ADRI can also be used to evaluate or rate the organisation’s activities and results. The figure above, ADRI Review Process Poster for Self-assessment, which you can download free of charge from our website, provides a structure for such an evaluation. Each of the four dimensions, ADRI, is evaluated and given a rating, which leads to identification of strengths and opportunities for improvement.

How does ADRI relate to PDSA?

The Plan-Do-Study-Act (PDSA) cycle, provides a step-by-step process to bring about improvement over time. ADRI provides specific dimensions to reflect upon the activities and results of an organisation at a specific point in time.

Both PDSA and ADRI are based on the learning and improvement cycle, also known as scientific method and action research. PDSA provides a method for realising improvement. ADRI provides a structure for identifying where improvement may be required.

How to find out more…

Download the PDSA 9-step Improvement Process poster.

Download the ADRI Review Process poster.

Read more about the learning and improvement cycle in our new book: IMPROVING LEARNING: A how-to guide for school improvement.