How to gauge consensus – use a Consensogram

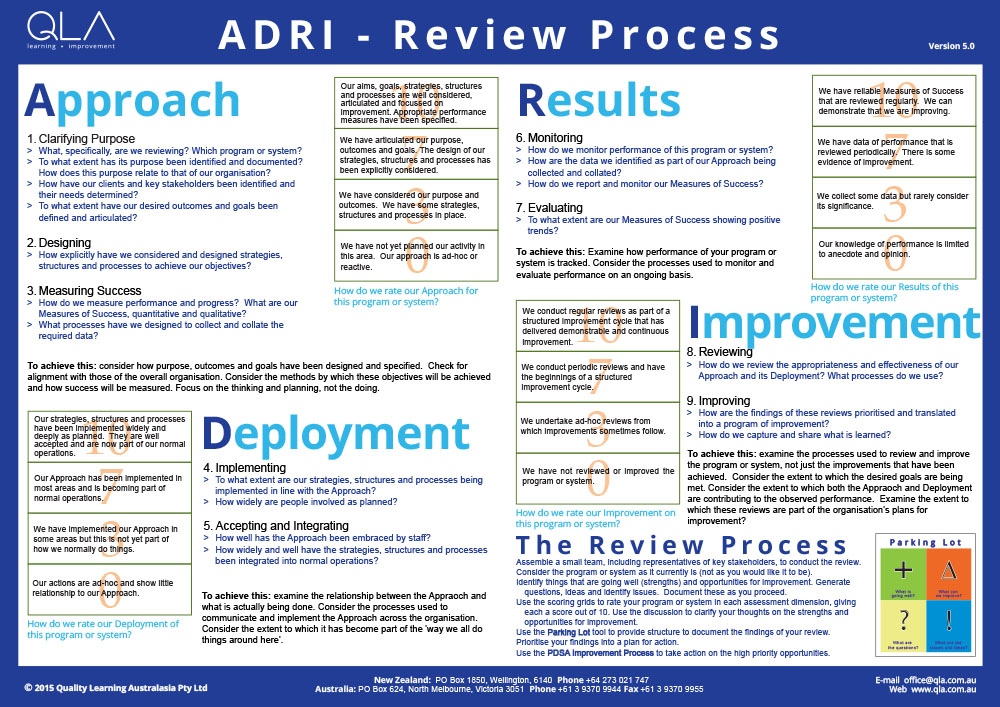
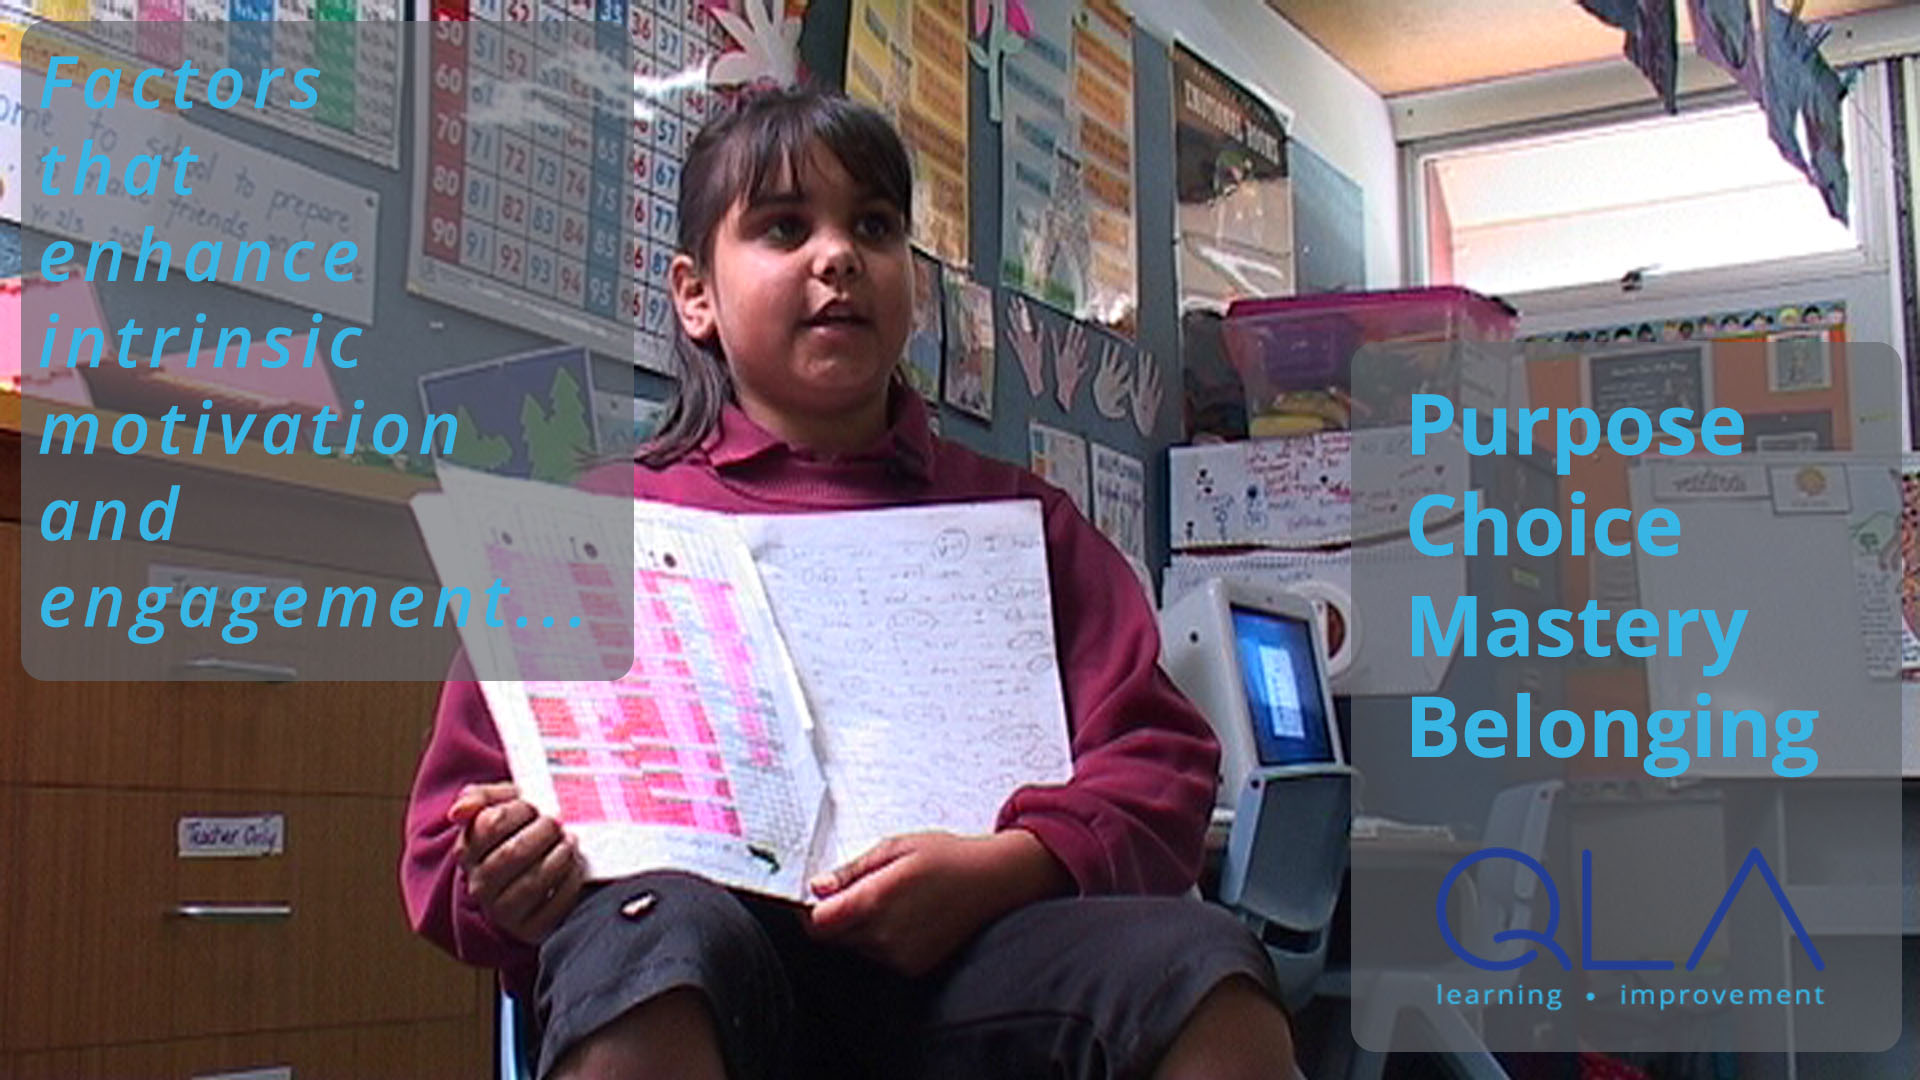
Quality learning provides administrators, educators, and students with the thinking and practical quality improvement tools necessary to continually improve schools, classrooms and learning. The Consensogram is one of these powerful and easy-to-use quality improvement tools.

Image of a consensogram
A consensogram

The Consensogram facilitates collaboration to support planning and decision making through the collection and display of data. It can be used to gain important insights into the perceptions of stakeholders (most often relating to their level of commitment, effort, or understanding).

The quick-to-construct chart reveals the frequency and distribution of responses. Although anonymous, it allows individuals to view their response in relation to the others in the group.

The Consensogram gives voice to the silent majority and perspective to the vocal minority.

At QLA, we use frequently use the Consensogram: applying it to diverse situations for the purpose of obtaining important data to better inform ‘where to next’.

How to

  1. Predetermine the question relating to the data to be collected.  Make sure the question is seeking a personalised response – it contains an “I” or “my” or “me”. We want people to give their view. E.g. “To what degree am I committed to…” or “To what degree do I understand…”  It can help to begin the question with ‘To what degree…’
  2. Predetermine the scale you wish to use. The scale may be zero to 10 or a percentage scale between zero and 100 percent.
  3. Issue each person with one sticky note. Make sure the sticky notes are all the same size. Colour is not important.
  4. Explain that you want people to write a number on their sticky note in response to the question posed.
    • No negative numbers.
    • If using the zero to 10 scale: the number should be a whole number (not a fraction e.g. 3¾ or 3.75, 55%), and a six or nine should be underlined so they can be distinguished.
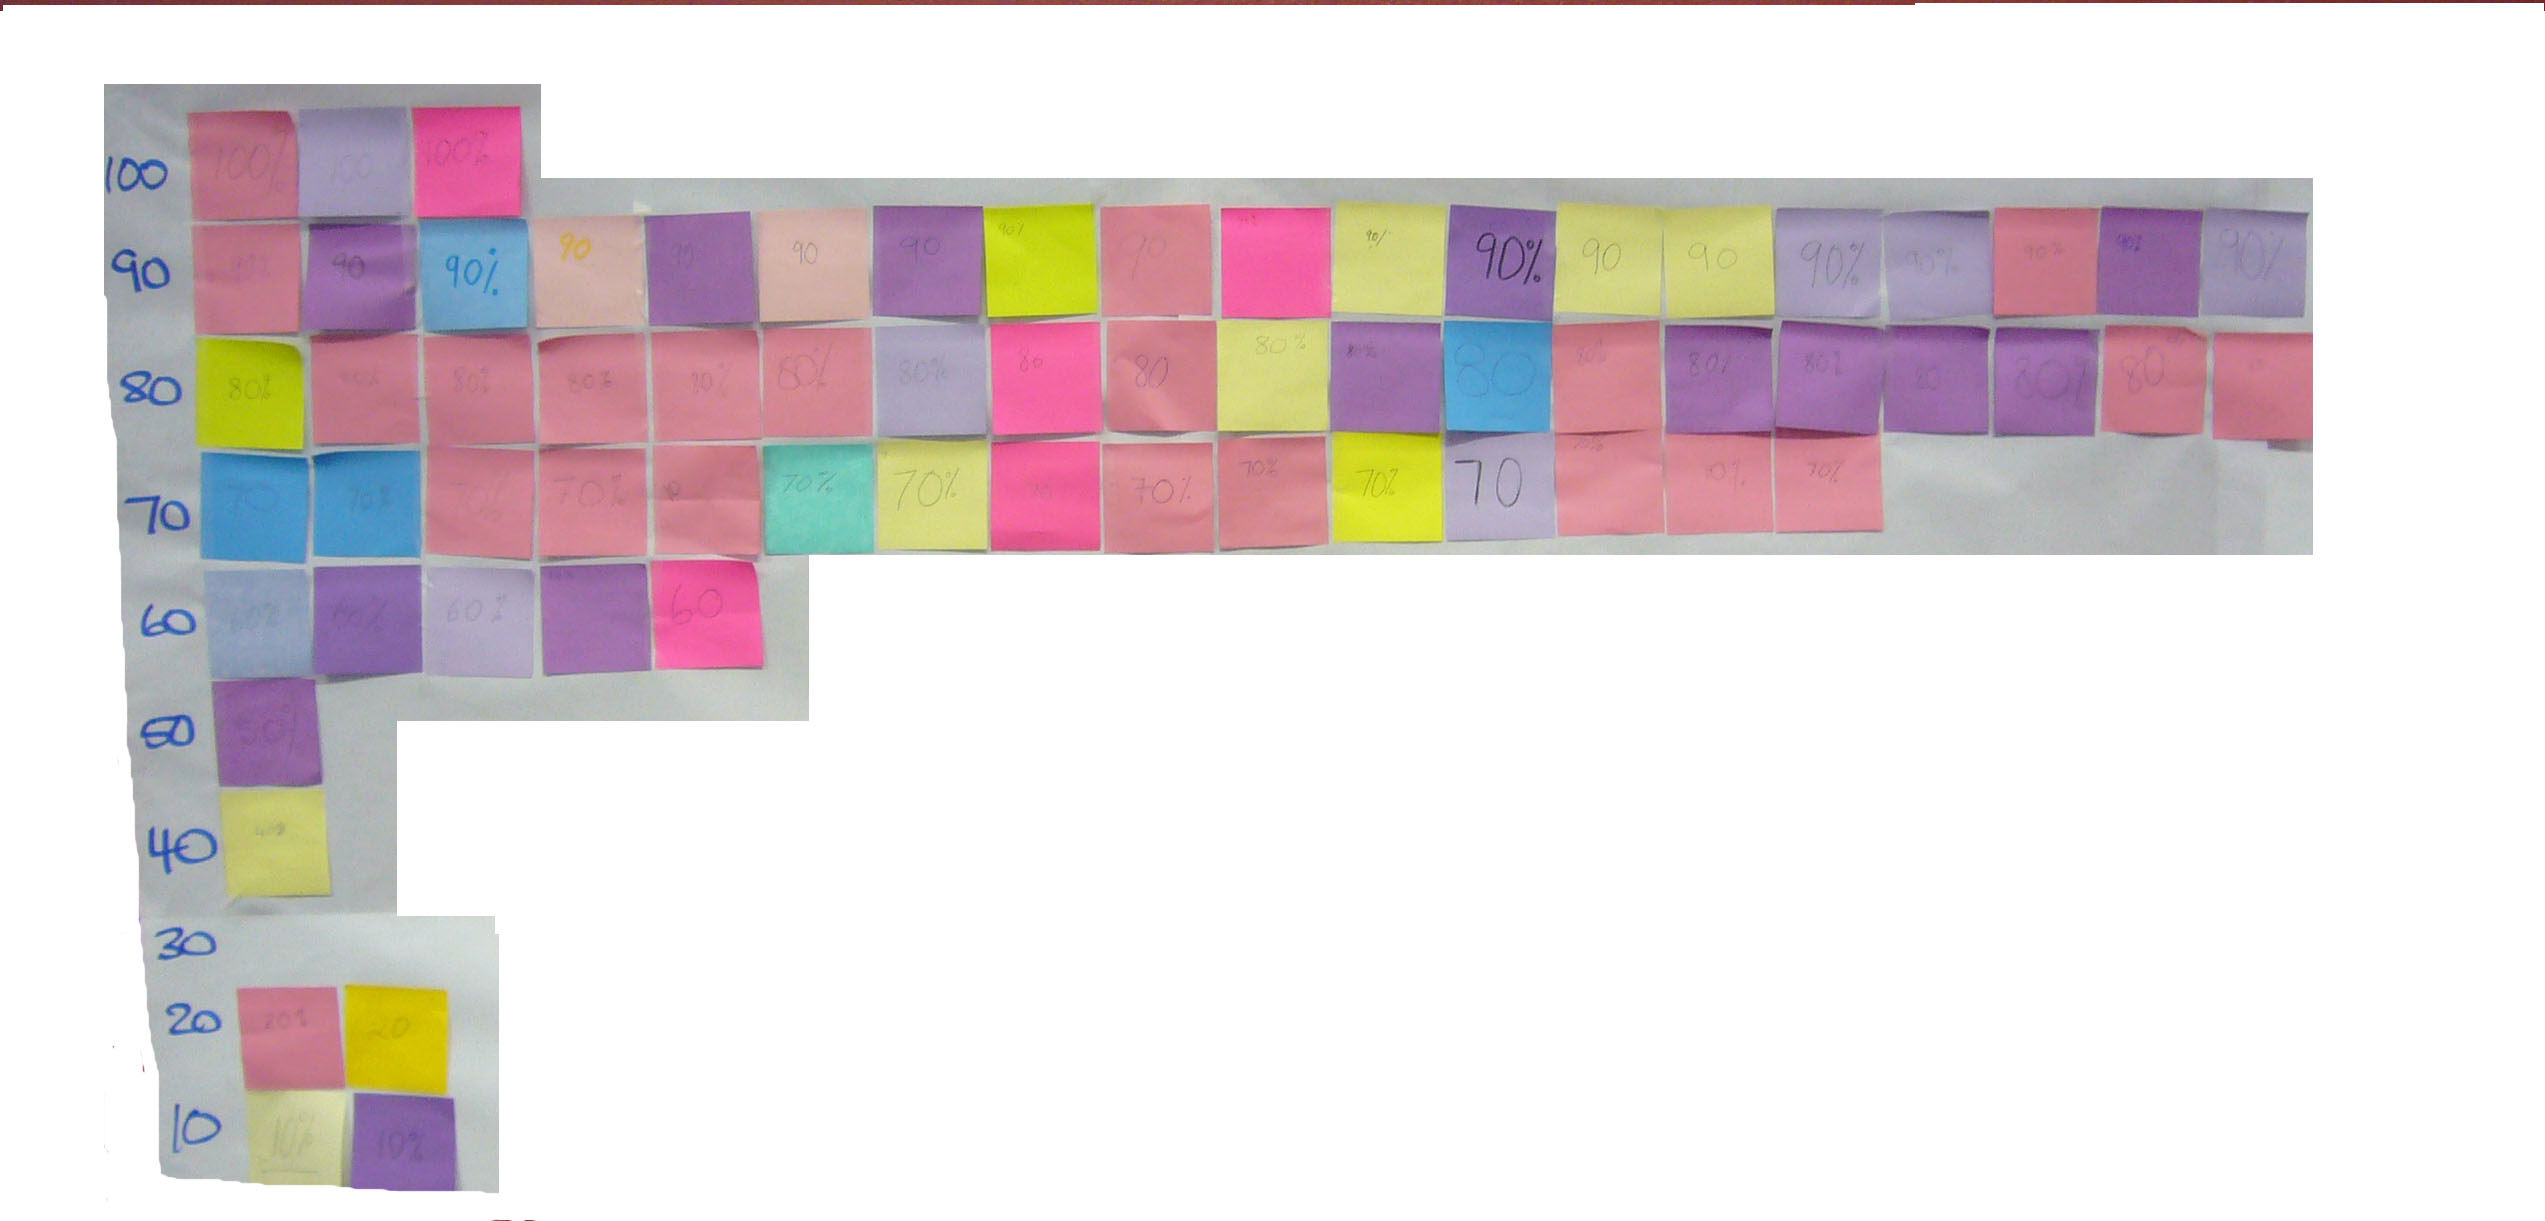
    • If using the zero to 100% scale, the numbers should be multiples of ten percent, i.e. 0%, 10%, 20%, and so on.
    • Names are not required on the sticky notes.
  5. Ask people to write down their response. This shouldn’t take long!
  6. Collect the sticky notes and construct the Consensogram, usually on flip chart paper. Label the consensogram with the question and a vertical axis showing the scale.
  7. Interpret the Consensogram with the group and use it to inform what to do next.
  8. Capture a record of your Consensogram by taking a photograph or saving the data on a spreadsheet. You can use a Consensogram template.

Some examples

Students feeling prepared for high school

Consensogram: students feeling prepared for high school

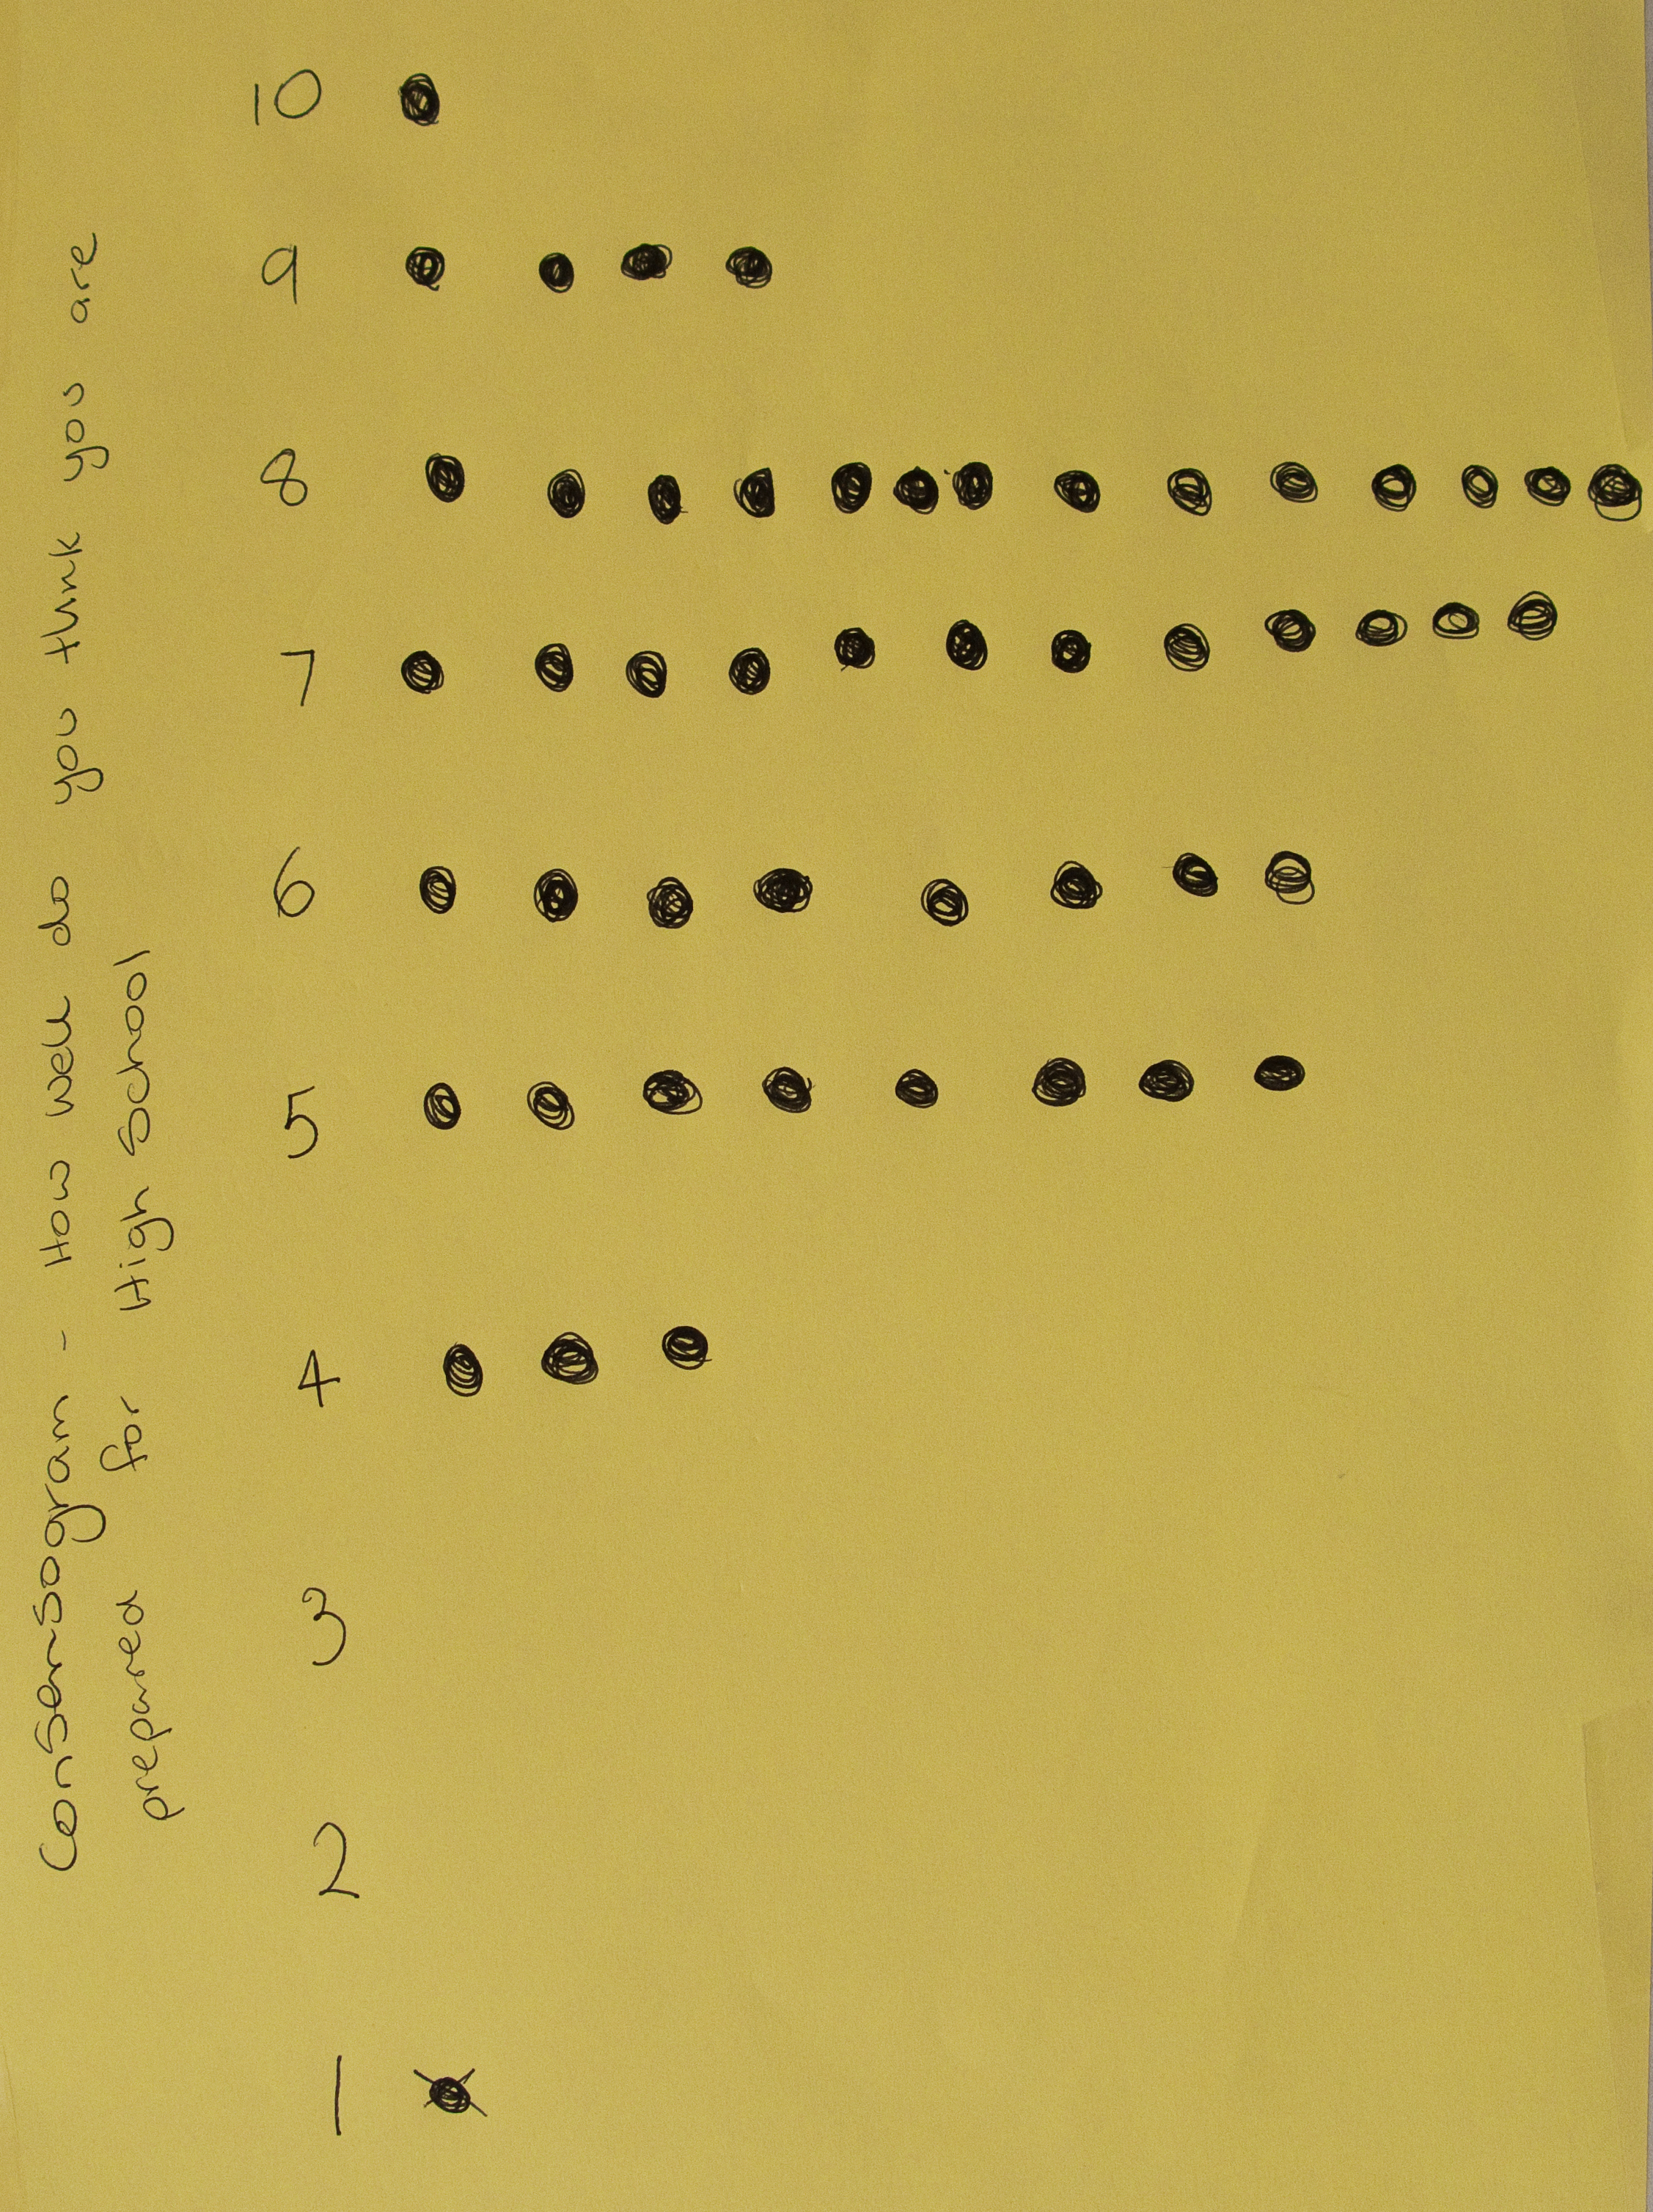
This first example was prepared by a classroom teacher to determine how confident Year 6 students were feeling about their transitioning to high school.

So what do the data reveal?

  • There is significant variation; the students believe they are prepared to different degrees for their move to high school (scores range from 10 to 4).
  • There is one outlier (special cause) – that is; one student who is  having a very different experience to others in the class (giving a rating of one). They report that they feel unprepared for the transition.

So where to next?

  • There is opportunity to improve student confidence by working with the whole class to identify and work together to eliminate or minimise the biggest barriers to their feeling prepared.
  • There is opportunity to invite the student who is feeling unprepared to work with the teacher one-on-one (case manage) to address their specific needs for transiting. This student should not be singled out in front of the class, but an invitation issued to the whole class for that individual to have a quiet word with the teacher at a convenient time. The ensuing discussion may also inform the transitioning process for the rest of the class.


Student engagement

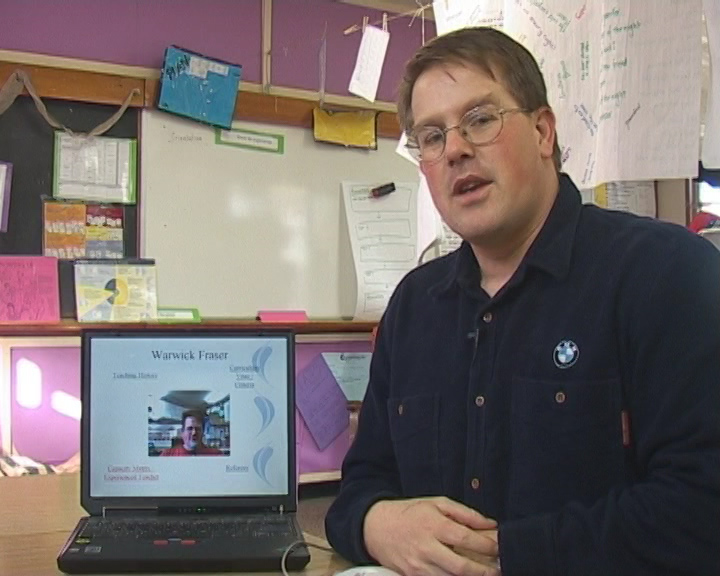
This example was created during a QLA professional development

Consensogram: how engaged are students in my classroom?

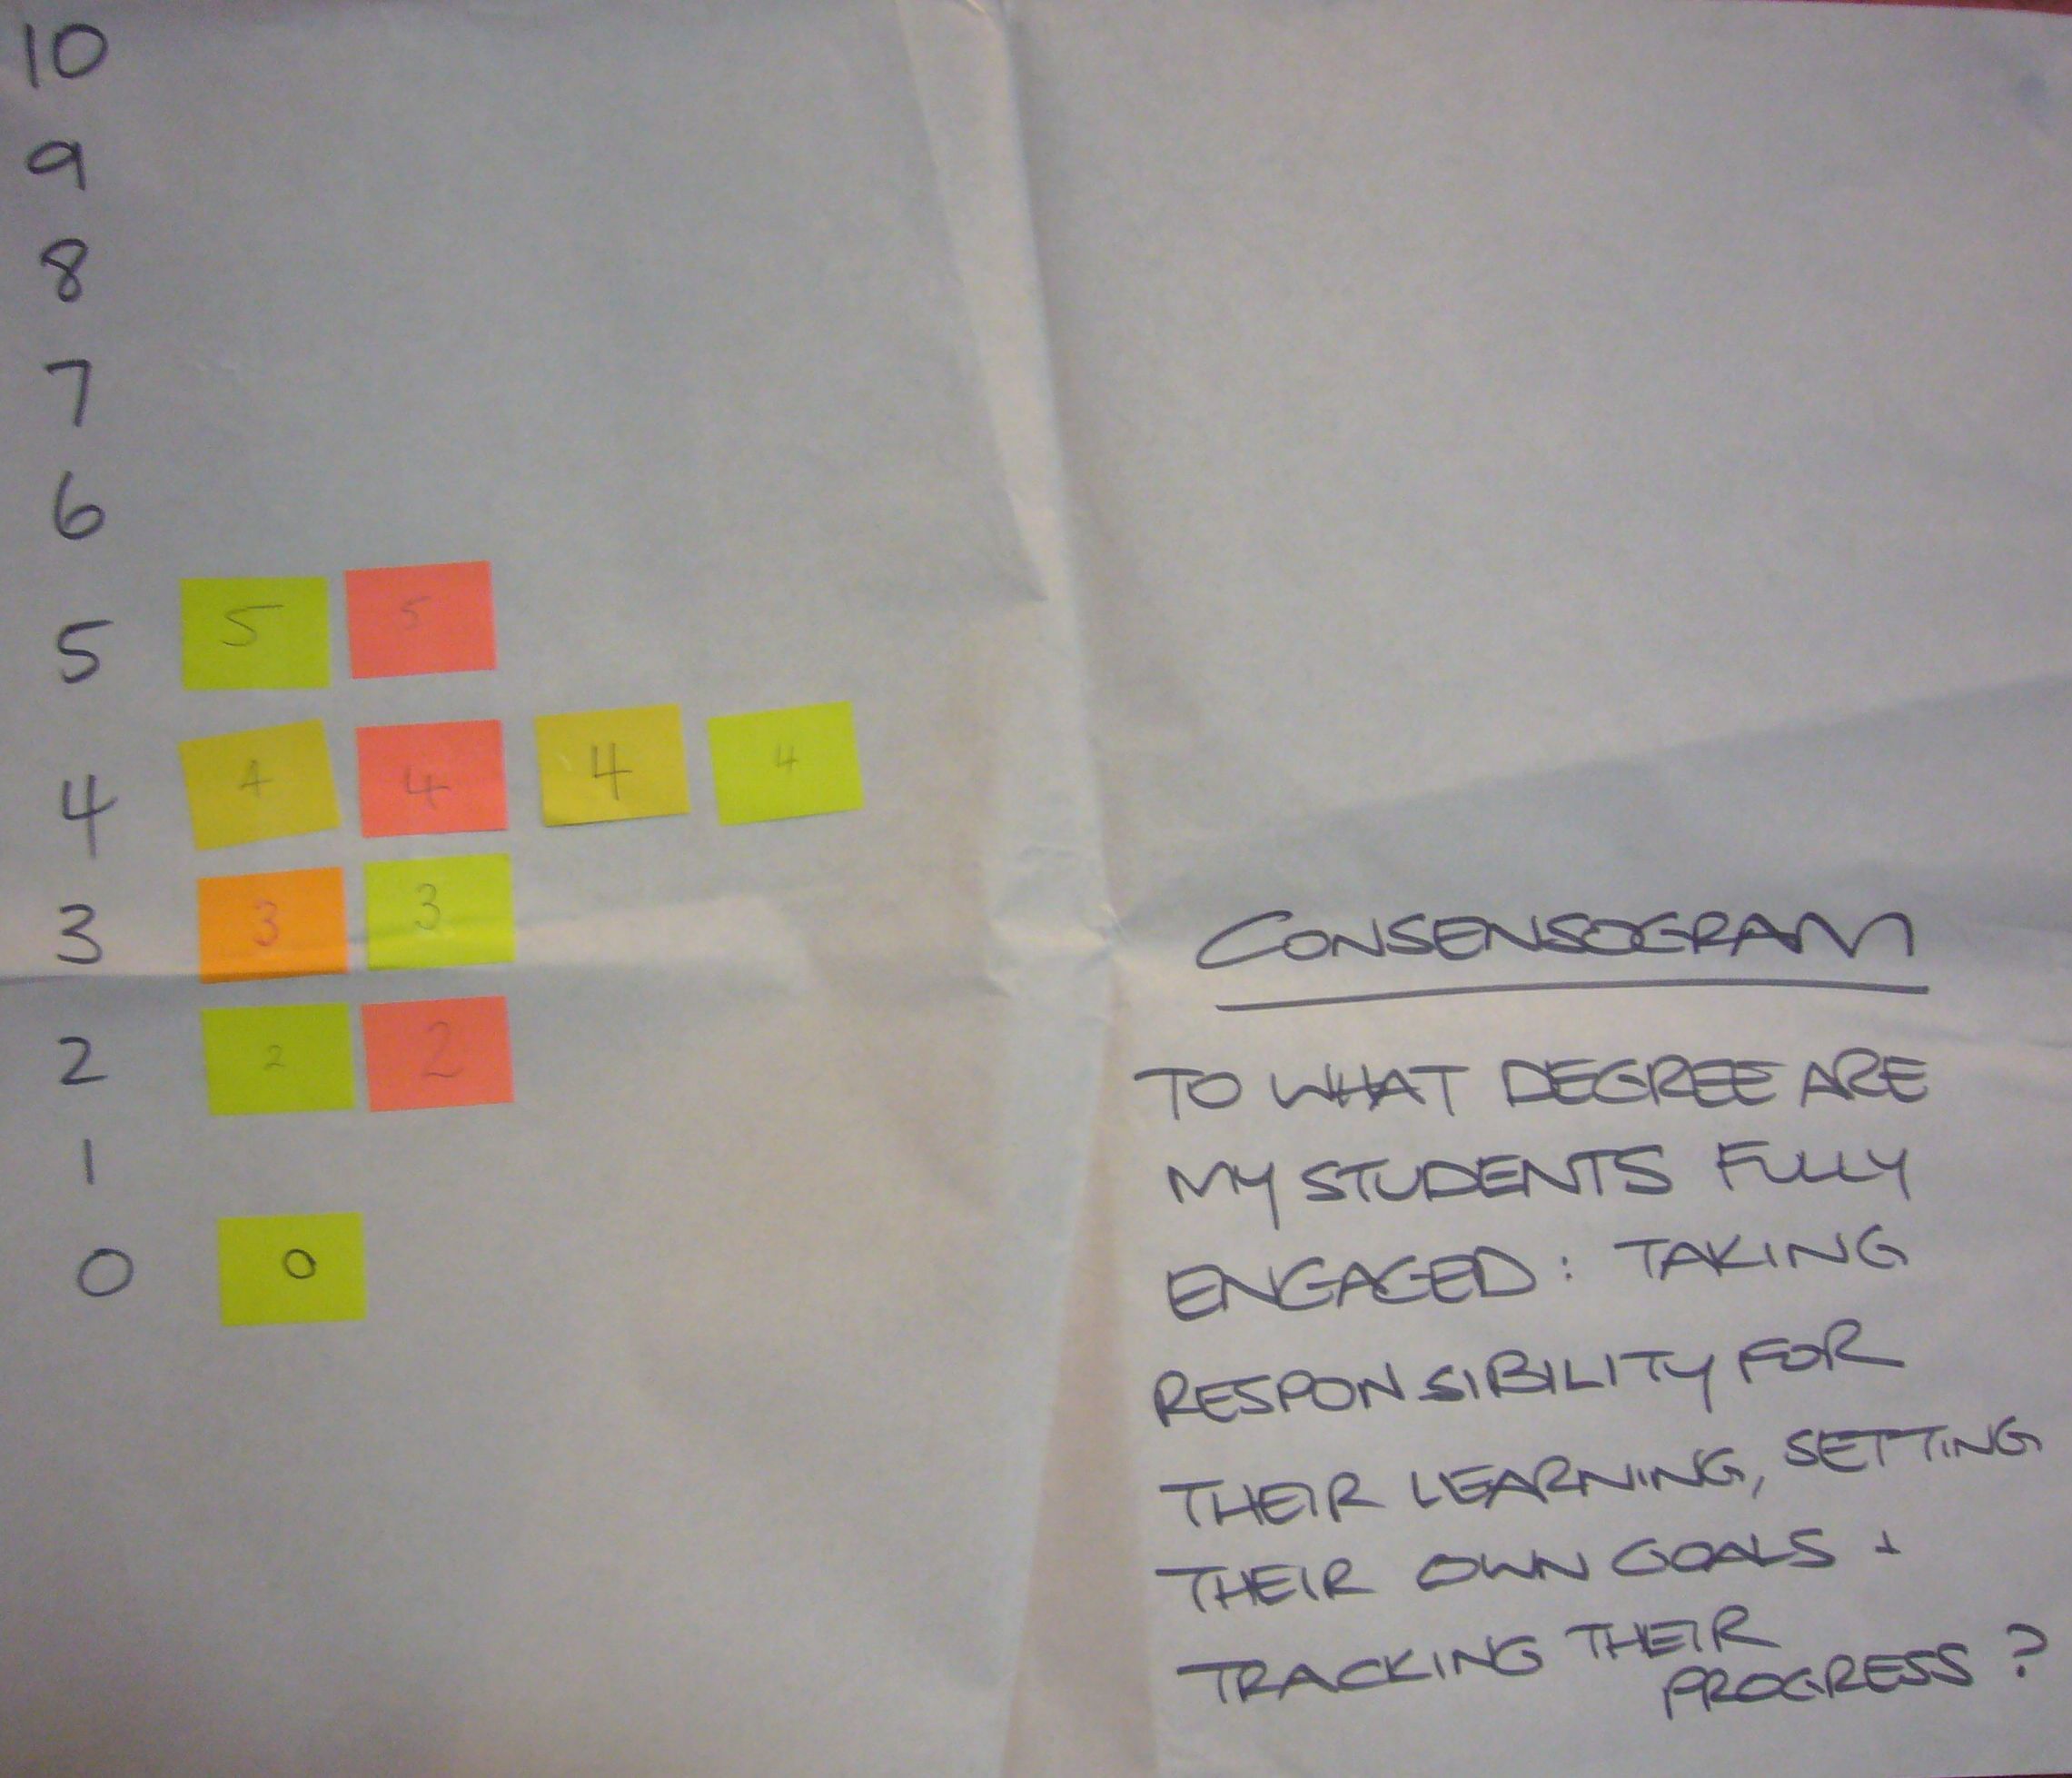
workshop with a small group of 11 teachers.

The question was: “To what degree are my students fully engaged: taking responsibility for their learning, setting their own goals and tracking their progress?”

So what do the data reveal?

  • There is variation; the teachers believe their students are at different levels of engagement in their classroom.
  • The data appears normally distributed data (a bell curve); there are no outliers (special causes) – that is; none of the teachers are having a very different experience to others in the group.

So where to next?

  • There is opportunity to improve student engagement; all of the data points are below 5 on the scale.
  • This data can help the group to understand the agreed current state and can motivate people to engage with improvement. It can also provide baseline data to monitor the impact of improvement efforts in the future.

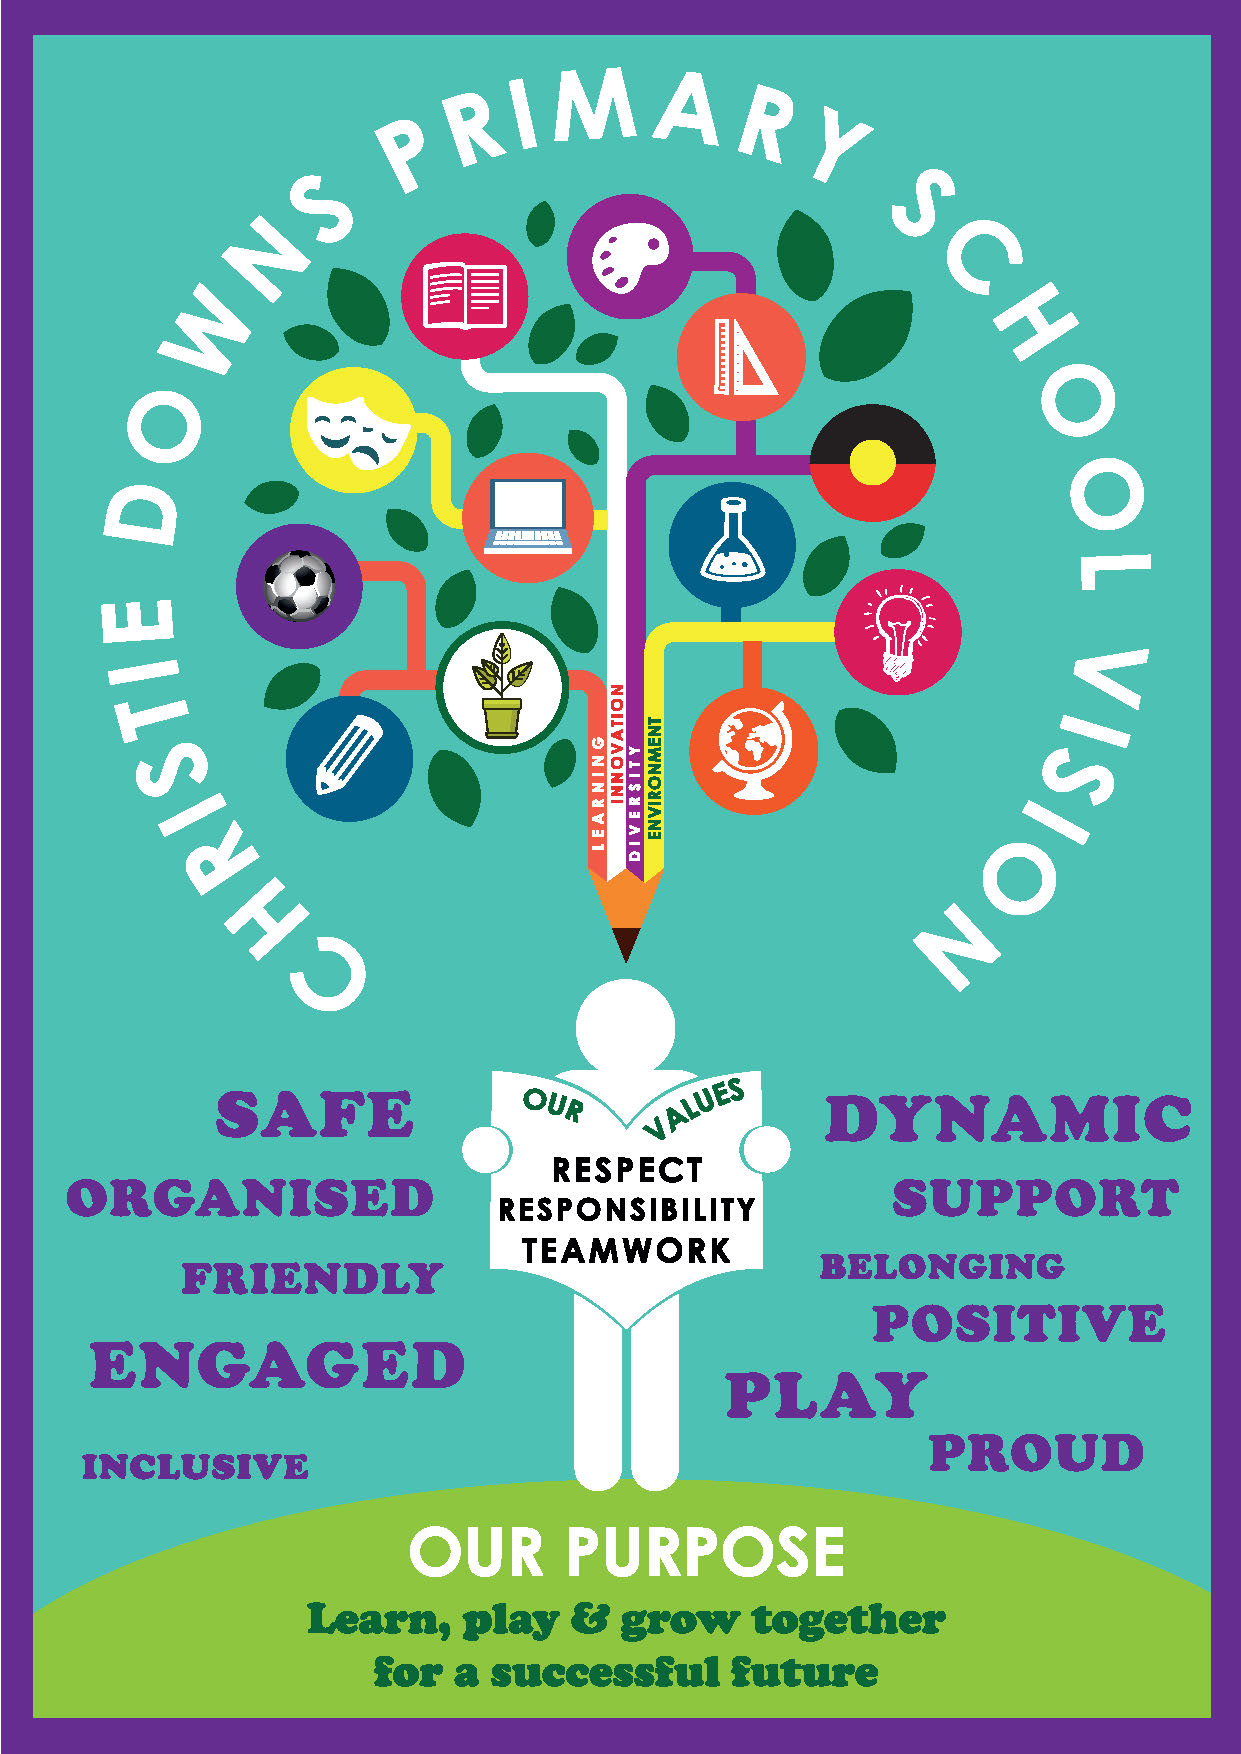
Commitment to school purpose

This example was created during school strategic planning with key stakeholders of a small school (parents, staff and students). A draft

Consensogram: how committed am I to our school purpose?

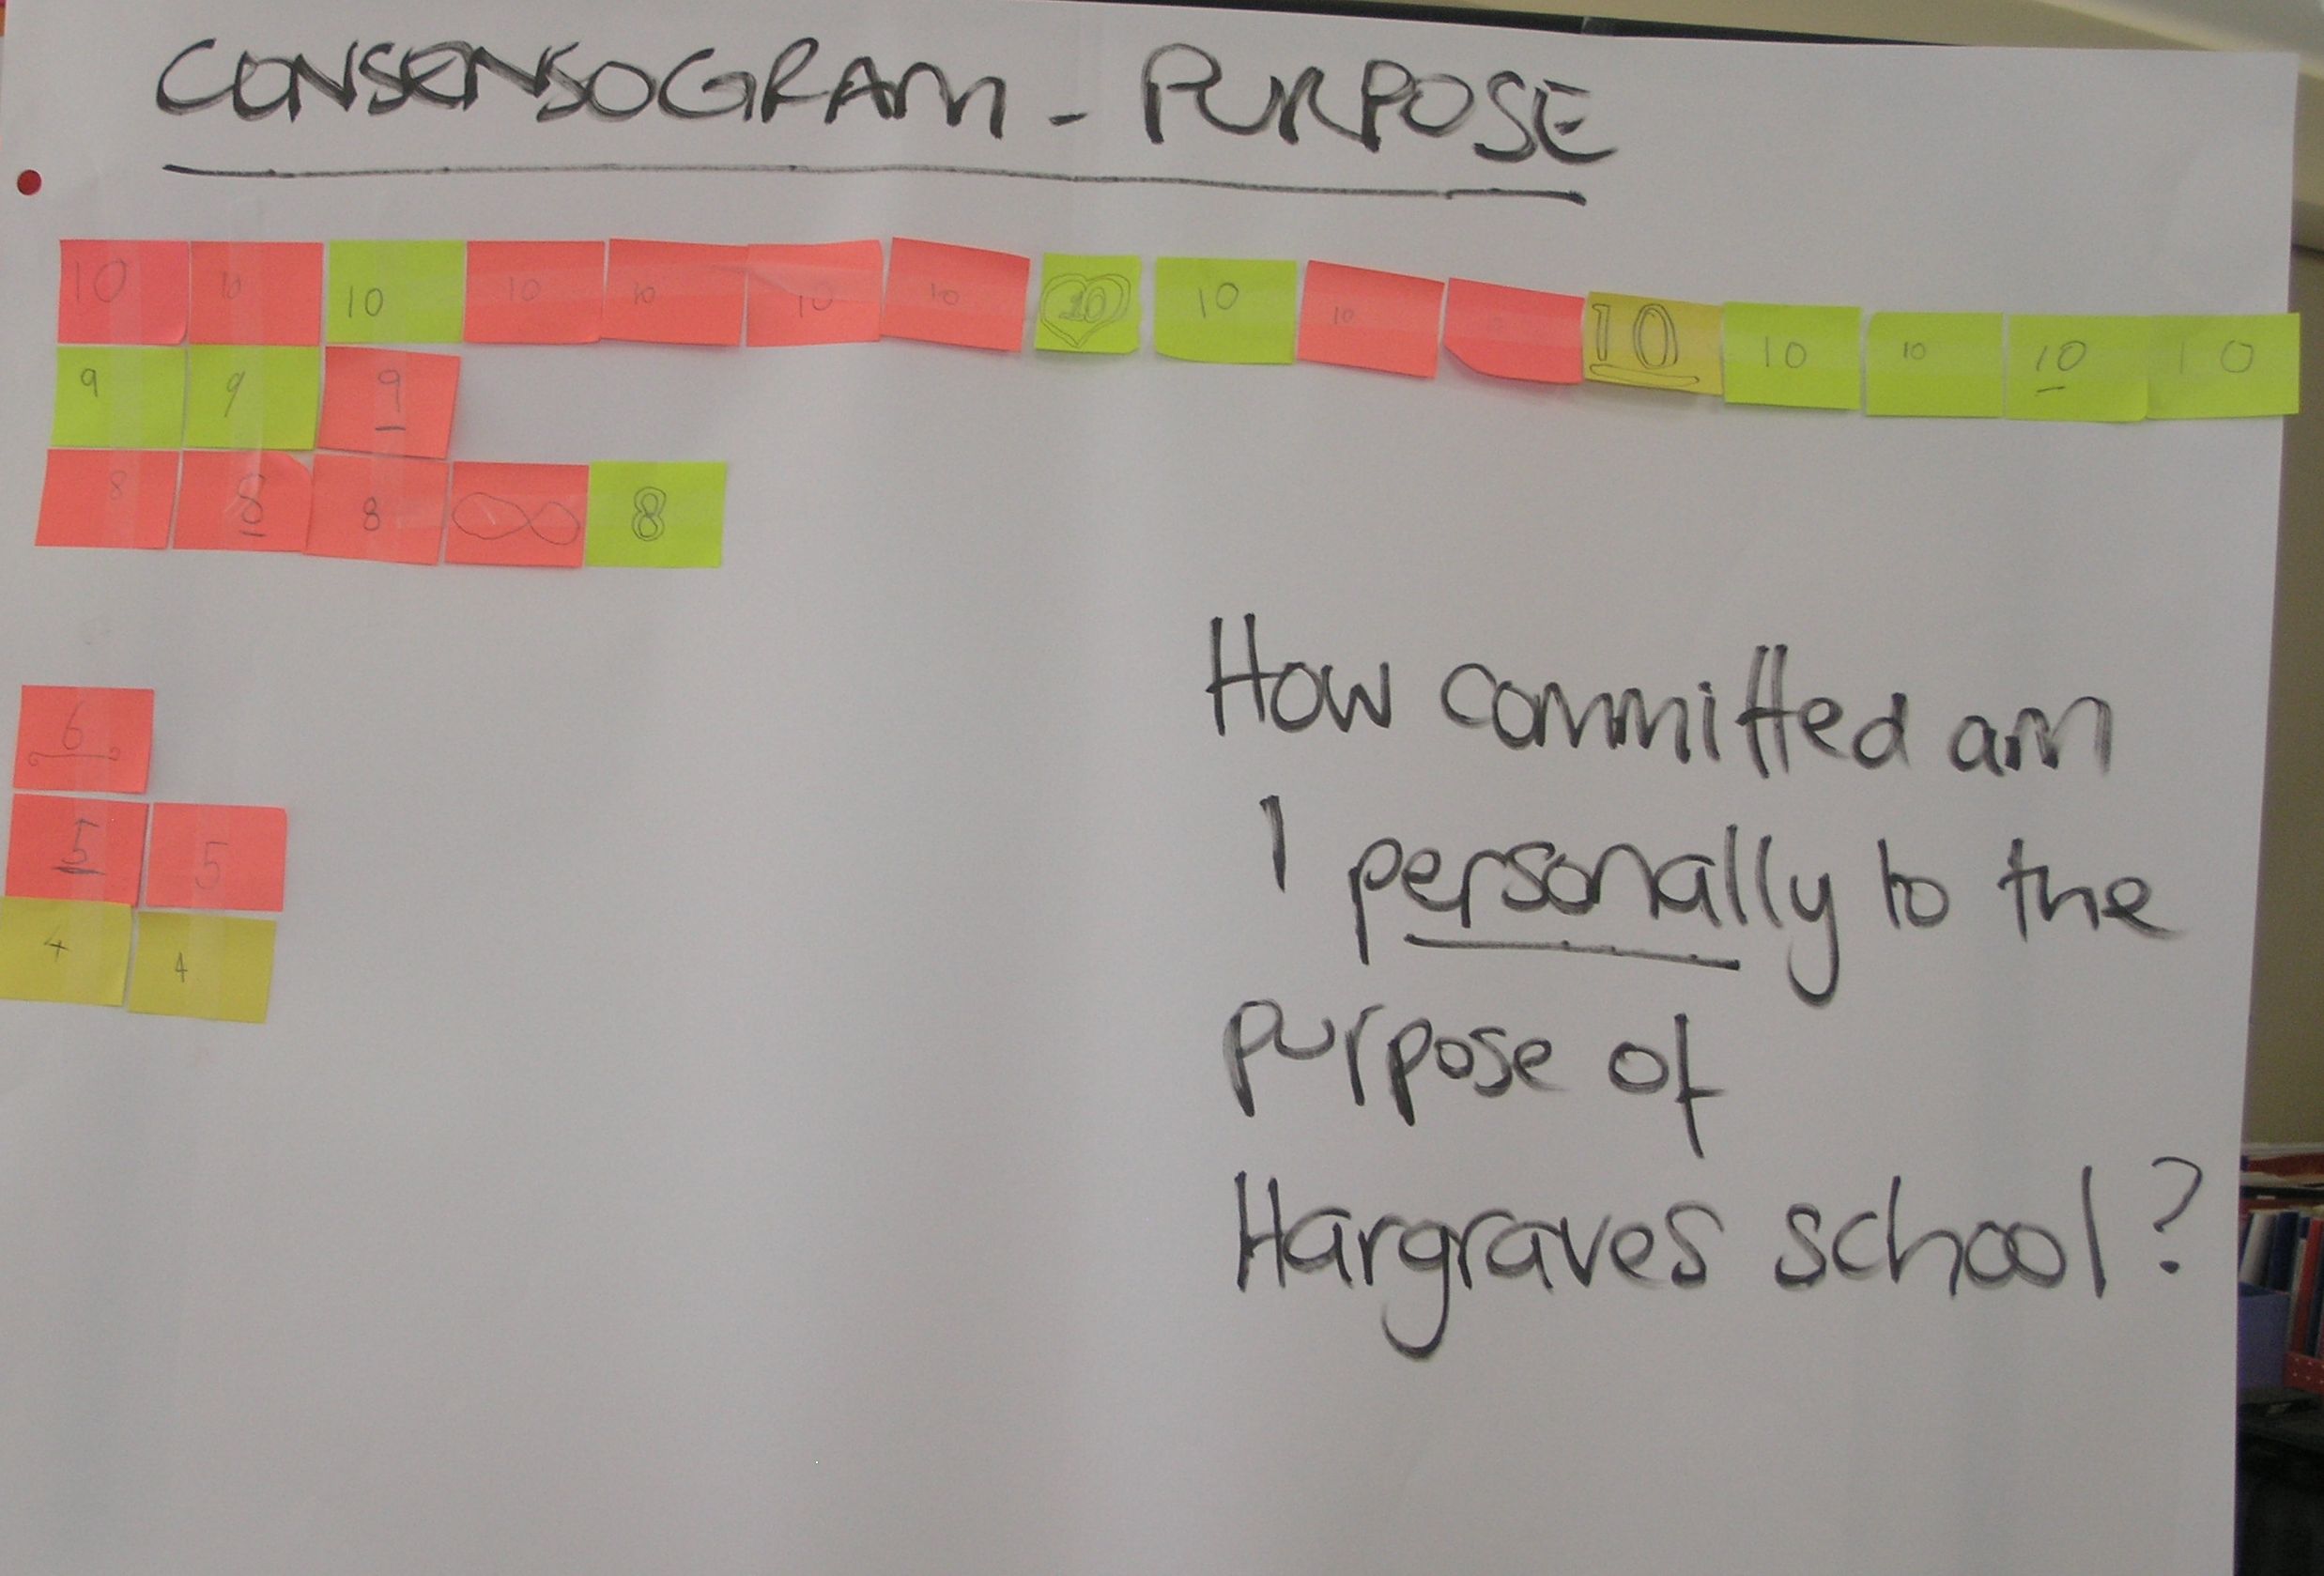
purpose statement was developed using stakeholder input (using a P3T Tool). The Consensogram was then used to measure the level of commitment to the draft statement. The question was: “How committed am I personally to the purpose of the school?”

The use of the Consensogram averted the need for long, frequently unproductive dialogue. It revealed the following:

  • There is variation; the stakeholders exhibit different levels of commitment to the school purpose.
  • Most are stakeholders are highly committed (the majority indicating a commitment level of 8-10).
  • A group of five stakeholders are less committed (a commitment level of 4-6). Their experience may be different to others in the group.

So where to next?

  • This presents an opportunity to invite the stakeholders with a different experience to share. It is very likely something can be learned to improve the purpose statement for everyone.

Learn more…

Watch a video example of a Consensogram being used for school planning (Hargraves System Mapping) on YouTube.

Investigate the key quality  improvement tools and concepts underpinning the use of the Consensogram, plus more examples in Improving Learning: A how to guide for school improvement.

Purchase a Using data to improve guide.

Download a Consensogram MS Excel template.

Using ADRI during school self-assessment

Using ADRI during school self-assessment

The assessment dimensions of Approach-Deployment-Results-Improvement (ADRI) can be very helpful for self-assessment. ADRI provides a structure under which the activities and results of an organisation can be broken down to identify, quite specifically, where the strengths and opportunities for improvement may lie.

ADRI provides a structured approach to organisational self-assessment. The ADRI dimensions help you to analyse how your organisation goes about: thinking and planning (Approach); implementing and doing (Deployment); monitoring and evaluating (Results); and reviewing and improving (Improvement).

It is a feature of the Australian Business Excellence framework and underpins many other performance excellence frameworks around the world.

ADRI Review Process
ADRI Review Process Poster for Self-assessment

Source: Adapted by QLA from the Australian Business Excellence Framework, the Malcolm Baldrige National Quality Awards Criteria and the European Foundation for Quality Management Excellence Model.

The ADRI assessment dimensions

Approach

Approach relates to the thinking and planning behind the area of endeavour – how it has been designed.

Considering an Approach leads to an examination of:

  • clarity of purpose
  • clients, key stakeholders and their respective needs
  • desired outcomes – the vision of excellence
  • design of strategies, structures and processes to meet the desired outcomes
  • identification of measures of success.

In most organisations the senior leaders, sometimes with the support of content specialists, determine the approach.

For example, senior leaders of a school, frequently with the help of a specialist curriculum committee, usually lead the approach to curriculum. It is the responsibility of these leaders to identify and make clear the purpose of curriculum in the school, the desired curriculum outcomes for the school, and to understand the needs of key stakeholders (including teachers, families and curriculum regulatory bodies). Armed with this understanding, the structures and processes (including documentation) necessary to meet the intentions of the school can be designed. It is during the design stage that the measures of success are also determined from the desired outcomes (the vision of excellence): what data will be used to monitor progress over time? Senior leaders do the thinking and planning – the design.

Deployment

Deployment relates to implementing and doing – how the design is put into effect.

Considering Deployment leads to an examination of:

  • the degree to which the designed strategies, structures and processes have been implemented across the organisation and down through the organisation
  • the extent to which staff understand and have embraced the organisation’s approach
  • how well the strategies, structures and processes have been integrated into the day-to-day operation of the organisation.

Those doing the daily work know most about how the daily work is done. Those that are expected to implement an organisation’s approach know most about it has been deployed. The school curriculum committee may have designed an excellent approach, but it is up to each classroom teacher to implement it. If classroom teachers are not adhering to the agreed school curriculum approach, it has not been deployed well.

Results

Results relates to monitoring and evaluating – how success is gauged.

Considering the Results dimension leads to an examination of:

  • how performance is monitored
  • how the data relating to the measures of success (determined as part of the Approach) are collected, collated and reported
  • the degree to which trends of improvement are evident in these data.

Monitoring and evaluating is a management responsibility. School leaders are responsible for monitoring and evaluating the data used as measures of success for their approach to curriculum. Unless these data are collected, collated and reported, the effectiveness of the approach and its deployment will be unknown.

Improvement

Improvement relates to the processes of reviewing and improving the approach and its deployment.

Considering the Improvement dimension leads to an examination of:

  • the process by which the appropriateness and effectiveness of the approach and its deployment are reviewed
  • how these reviews have led to improvement
  • how the lessons learned are captured and shared.

Improvement is a management responsibility. Continuing the school curriculum example, a school’s senior leaders are expected to regularly review and refine the school’s curriculum. This assessment dimension examines the process by which that is undertaken, the improvements that have resulted and how these improvements are documented and shared with staff and other key stakeholders.

Why ADRI is useful

The assessment dimensions are useful for two purposes: diagnosis and design.

Diagnosis

When something is not working well in an organisation, ADRI provides a lens for examining activities and results to determine why it isn’t working and then to determine what to do about it.

When things aren’t going well, it could be because:

  1. the Approach is weak
  2. the Deployment is poor.

If the approach is weak, attention must be paid to reviewing and improving the design. Deploying a poor approach will not deliver good results.

A sound approach, poorly deployed, will not deliver good results either. If the approach is well thought through but is not being applied, then attention needs to be paid to ensuring people know about and implement the agreed approach.

Note that these two causes – a weak approach and poor deployment – have the same effect: disappointing results. Yet the actions required to address the disappointing results are quite different. ADRI can assist in determining which cause is more significant.

For example, a school may identify parent dissatisfaction with student reports. Firstly, knowledge of ADRI would lead the school leadership team to seek clarity and reflect upon the school’s design for assessment and reporting. Which assessments are to be undertaken? What is the schedule? What is the agreed process for reporting? Is the approach appropriate? These are questions regarding the approach. Secondly, they would explore the extent to which the approach is being applied in practice. Do staff understand and follow the agreed procedures? Are timelines being met? These are questions regarding deployment. Actions required to address parent dissatisfaction will be quite different depending where the opportunities for improvement lie: in the approach, or more to do with deployment.

Design

ADRI is also useful when designing organisation’s systems, structures and processes. In thinking about how to pursue any area of endeavour, ADRI provides useful guidance to ensure key considerations are not overlooked. If you look back over the considerations associated with each of the dimensions, you can easily identify key questions to be answered when determining how to design processes that will achieve an organisation’s goals. These questions could include:

  • Have we clearly articulated our purpose, desired outcomes and a vision of excellence?
  • What are the needs of our clients and key stakeholders?
  • What strategies, structures and processes are required to achieve our aspirations?
  • What data do we need to measure effectiveness and track progress over time? How will these data be collected, collated and regularly reported?
  • How will we document, train and coach people to adopt the new approach?
  • How will we monitor the acceptance and application of the new approach?
  • How will ongoing performance data be monitored and evaluated?
  • What is the cycle of review and improvement for this approach and its deployment?

How to use ADRI

The assessment dimensions of ADRI can be used in many ways. Typically, they are used as:

  1. a checklist for reflecting upon the activities and results of an organisation
  2. a framework for describing the activities and results of an organisation
  3. an assessment model to evaluate the activities and results of an organisation.

ADRI is commonly used as a checklist to think about what is happening in an organisation. For example, thinking about whether observed difficulties are due to a deficient approach or poor deployment is a common application.

ADRI can provide a structure for describing how an organisation goes about its business. This use of ADRI is common in performance excellence awards processes such as those based on the Australian Business Excellence Awards, the Malcolm Baldrige National Quality Awards in the USA, and those of the European Foundation for Quality Management. Organisations describe explicitly how they go about each assessment dimension for each area of endeavour. The areas described are usually the categories or items of these specific frameworks (for example, Leadership, Strategy and Planning, Customers and Other Stakeholders). The use of ADRI in this way is applicable to any area of organisational activity.

A school (or district) could use ADRI as a structure to describe any program, initiative, project or other area of endeavour. For example; a district could document its thinking and planning (approach) to community engagement, how that has been implemented across the district (deployment), how data demonstrate effectiveness in community engagement (results), and the process by which the district reviews and improves community engagement (improvement). The act of documenting the activities and results in this structure usually leads to the identification of strengths and areas of opportunity for improvement.

ADRI can also be used to evaluate or rate the organisation’s activities and results. The figure above, ADRI Review Process Poster for Self-assessment, which you can download free of charge from our website, provides a structure for such an evaluation. Each of the four dimensions, ADRI, is evaluated and given a rating, which leads to identification of strengths and opportunities for improvement.

How does ADRI relate to PDSA?

The Plan-Do-Study-Act (PDSA) cycle, provides a step-by-step process to bring about improvement over time. ADRI provides specific dimensions to reflect upon the activities and results of an organisation at a specific point in time.

Both PDSA and ADRI are based on the learning and improvement cycle, also known as scientific method and action research. PDSA provides a method for realising improvement. ADRI provides a structure for identifying where improvement may be required.

How to find out more…

Download the PDSA 9-step Improvement Process poster.

Download the ADRI Review Process poster.

Read more about the learning and improvement cycle in our new book: IMPROVING LEARNING: A how-to guide for school improvement.

A recipe for building an expert teaching team

Do you need a step-by-step guide to targeting professional learning to develop your expert teaching team? Then follow these simple instructions to establish an evidence-based, structured process to plan,  monitor and evaluate the professional development of staff in your school:

Warwick Fraser and his digital portfolio
Warwick Fraser explains how he uses his Capacity Matrix and Digital Portfolio
  1. Download a capacity matrix template. You can use the matrix in either hardcopy or digital format.
  2. Agree with staff what they need to know, understand and be able to do to be effective in their school roles. Identify the specific skills and capacities as they relate to key concepts and methods. Insert them into the matrix template. Draw on preferred models and professional standards like the AITSL Australian Professional Standards for Teachers. Be sure to also include the capacities unique to your school system (e.g. do you have a school-based data software people need to know how to use, a behaviour management policy, a role call process?). 
    Also consult your Strategic and Annual Plans for new developmental needs and these capacities to the matrix. In this way the matrix is a dynamic (ever evolving) document subject to ongoing review and improvement.
  3. Have each staff member undertake a regular self-assessment using the matrix. This self-assessment can be made an integral part of your school staff performance management/development process.
  4. Staff (like younger learners) are required to provide evidence of their learning. Evidence is recorded in the evidence column of the matrix. Staff can use a portfolio to store their evidence (in the same way as students do). This can take many forms; video footage or podcasts of teachers demonstrating good teaching practice, photos, students articulating their learning. This evidence is an effective measure of the extent to which professional learning is ultimately applied in the classroom.
  5. Use the capacity matrix to identify individual learning goals and monitor progress towards achieving them.
  6. Use the matrix as a basis for the induction of new staff.
  7. Use the matrix to plan ongoing professional development. Identify those areas where a majority of staff require professional development and plan the most cost-effective way for this to be facilitated. For example, those staff who have reached mastery (or are at the wisdom level) in specific capacities can teach, coach or mentor those at lower levels of learning.

National Teacher Stds Capacity Matrix Ver1 03Jul12

Here are some we prepared earlier!

Want to know more…?

Four types of measures, and why you need them

Using data to improve

There are four types of measures necessary for monitoring and improving systems such as schools and classrooms. These are:

  1. Performance measures
  2. Perception measures
  3. Process measures
  4. Input measures.

Performance and perception measures are generally well understood within schools; not so process and input measures. This post seeks to illuminate the use and significance of each type of measure. It is an edited extract from our forthcoming book IMPROVING LEARNING: A how-to guide for school improvement.

Performance Measures

Performance measures are defined to be:

measures of the outcomes of a system that indicate how well the system has performed.

Performance measures relate to the aims of the system. They are used to quantify the outputs and outcomes of the system. In this way, performance measures relate to the key requirements of stakeholders as reflected in the aims of the system.

Examples of performance measures in a school include:

  • student graduation and completion rates
  • student results in national, state and school-based testing
  • expenditure to budget
  • student and staff attendance.

Performance measures answer the question:
how did we go?

They are collected and reported for three reasons:

  1. To understand the degree to which the aims of the system are being met
  2. To compare performance of one system with that of another similar system
  3. To monitor changes in performance over time.

Performance measures have two major deficiencies: they report what has happened in the past; and they generally provide no insight into how to improve performance. For these reasons, we need other types of measures as well.

Perception Measures

Perception measures are defined to be:

measures collected from the stakeholders in the system in order to monitor their thoughts and opinions of the system.

Perception measures provide insights into peoples’ experience of the system. Given that people make choices based on their perceptions, whether these are accurate or not, perception measures provide valuable insights that can be useful in explaining and predicting behaviour.

Perception measures are collected and reported for three reasons:

  1. To understand the collective perceptions of key stakeholder groups
  2. To identify perceived strengths and opportunities for improvement
  3. To monitor changes in perceptions over time.

For schools, it is important that data are collected and reported regularly regarding the perceptions of staff, students and families. This data can include:

  • opinions regarding the school’s services
  • satisfaction with the school and its operation
  • thoughts and opinions about specific aspects of the school.

Perception measures answer the question:
what do people think of the system?

Note that care is required to ensure adequate random samples are collected for perception data to be reliable.

Process Measures

Process measures are defined to be:

measures collected within the system that are predictive of system performance and which can be used to initiate adjustments to processes.

Process measures are used to monitor progress and predict final outcomes. Most importantly, process measures are used to identify when changes are required in order to bring about improved performance.

Examples of process measures in schools include:

  • progressive student self-assessment of knowledge and skills, such as ongoing self-assessment using a capacity matrix
  • practice tests
  • teacher assessment of student progress
  • home learning and assessment task completion rates
  • monthly financial reports.

Notice that at the classroom level, process measures relating to learning are also known as ‘formative assessments’ – assessment used to inform the learning and teaching processes. These short, sharp and regular assessments are used to identify what to do next to improve the students’ learning progress.

Process measures are collected and reported regularly. This enables intervention when a process appears to be at risk of delivering unsatisfactory outcomes — before it is too late. With student learning this is critical so that mediation — improvements to learning — can be made, ensuring that high levels of learning are maintained.

Process measures answer the question:
how are we going?

Input Measures

Input measures are defined to be:

measures collected at the boundary of the system to quantify key characteristics of the inputs that affect system operation.

Inputs to a system affect system performance. In the manufacturing sector, the key characteristics of important system inputs – such as material thickness or lubricant viscosity – can be controlled. Other key process input variables cannot be controlled and process adjustments are necessary based on measurements of these inputs. For example, farmers cannot control rainfall, but they can adjust their rates of irrigation based on rainfall measurements.

Teachers cannot control the prior learning of their students, but they do adjust their classroom processes based on this input characteristic. Similarly, very few schools can control the value that their students’ families place on education, but they can adjust school processes based on data about this.

Input measures — data relating to critical characteristics of key inputs to a system — are required to ensure that appropriate actions are taken within the system to accommodate changes and variation in inputs. They are also required if systems are to become robust to input variation.

The core process in a school is learning (not teaching). The learning process is subject to enormous variation in inputs. Key input variables include students’ prior learning, motivation to learn, family background, home support and peer pressure, to name a few.

Any classroom of students will display enormous variation in these inputs. It is not uncommon, for example, to have a class of 13-year-olds with chronological reading ages varying from seven to 18 years. Understanding input variation is crucial to designing learning processes that cater to the many and varied needs of all students.

At a whole school level, there is variation among teachers. Teachers’ knowledge of the content they are required to teach is not uniform, nor is their knowledge of students’ learning processes or the programs in use at the school. Experience with school and education system compliance requirements can also be highly variable. School processes need to take account of this input variation.

Like process measures, input measures are used to make adjustments to system and process design and operation in order to ensure consistently high performance.

Input measures answer the question:
what are the key characteristics of the inputs to the system?


To recap, there are four sets of measures that can be used for monitoring and improving systems:

  1. Performance measures
  2. Process measures
  3. Perception measures
  4. Input measures.

Taken together, these measures provide deep insight into the performance, operation, and behaviour of a system. These measures provide a voice with which the system can speak about its behaviour, operation and performance. Importantly, these measures support analysis and prediction of future system behaviour and performance.

The four sets of system measures can be collected for a whole system as well as for subsystems within it. In school systems, this means that these data can be collected at the state, region/district, school, sub-school, classroom, and student levels.

Watch a video that describes these four types of measures.

Purchase our Learning and Improvement Guide: Using Data to Improve. 

Learn more about our forthcoming book, IMPROVING LEARNING: A how-to guide for school improvement.

Sharing a Vision

The importance of shared vision

At its simplest level, a shared vision is the answer to the question,
“What do we want to create?”
Peter Senge, 1990, The Fifth Discipline, p206.

A shared vision is a mutual agreement as to the desired future state key stakeholders are working together to create. It helps to align effort, optimise contribution, and to maximise organisational performance and improvement.

Many organisation improvement models recognise the importance of establishing a shared vision. The National School Improvement Tool (ACER 2012) describes the need for; ‘an explicit improvement agenda’. The Australia Business Excellence Framework (SAI Global 2011) defines an excellent organisation as one that; ‘defines its purpose, vision and values for organisational success and ensures it is understood and applied across the organisation’.

How to create shared vision

So, if stakeholder commitment to a shared vision of excellence is critical to organisational wellbeing, how do we make it happen?

Christie Downs Primary School in South Australia has done so – to great effect! The school, of 270 students, includes 90 learners with special needs supported by an integrated Disability Unit. The current school was established four years ago through the merging of two sites, an existing primary and special school. Two different cultures and organisations needed to come together to work as one. The school engaged key stakeholders in creating a shared school vision. The vision would also inform the new school’s four-year strategic plan.

Every student and staff member took part in at least one of a series of workshops to provide their ideas. Parents, families and other community members were invited to attend either a student or after hours workshop to have their say. Students with special needs were interviewed using creative one-on-one techniques that gave them a ‘voice’. Stakeholder input was then collated and a vision drafted by a team comprising students, parents and staff. Students were allowed to lead the team to ensure the crafting of a simple, jargon-free, to-the-point guiding statement. The resulting draft was communicated to all stakeholders, agreed, and used to inform the school strategic plan.

The vision has guided improvement activity and decision-making across the school for the last four years. Leadership and staff attribute the positive culture the school enjoys today to the ownership and commitment generated through this visioning process.

Earlier this year, the fourth in the school’s planning cycle, stakeholders were invited to reflect on achievements and again have input to the school vision to inform the next strategic plan. A refined school purpose, values and behaviours, and graduate profile were also agreed. The process was very similar to that used four years previously with all students, staff and families inputting their ideas. However, this time the school team (again comprising students, parents and staff) chose to summarise and communicate the revised school direction by way of an image: that of a tree (pictured below).

Christie Downs Primary School Vision

All stakeholders are really excited about their tree metaphor!  The tree roots are the school’s purpose. The supporting trunk of the tree are the key elements of the school vision – ‘learning, innovation, diversity, and environment’, these underpin the strategies of the school plan. The values of the school are in the hands of the stakeholder who stands beneath the tree branches and leaves – the graduate profile – the skills and capacities, attitudes and behaviours developed by the students of the school.

Congratulations Christie Downs!

So what is different about this approach?

This collaborative process:

  • involves all key stakeholders of the school community – everyone has a ‘voice’
  • celebrates diversity, allowing for a richness of ideas to flourish (this is not possible when only a few in the organisation are involved)
  • builds shared understanding, ownership and commitment.

To learn more about creating shared vision…

Watch a video

Purchase a QLA System Mapping Guide

Read our forthcoming book ‘Improving Learning: A how to guide for school improvement’.

Human Motivation 4. From Rewards to Collaboration for Improvement

This is the final of a series of four posts to explore human motivation, and how we can encourage learners’ intrinsic motivation and engagement. These posts are edited extracts from our forthcoming book: Improving Learning: A how-to guide for school improvement.

In the previous posts we introduced the concepts of motivation, rewards, punishment, compliance and engagement. We explored a framework of factors to enhance intrinsic motivation and engagement, namely: Purpose, Choice, Mastery and Belonging.

Factors that enhance intrinsic motivation and engagement: Purpose, Choice, Mastery and Belonging

In this post we conclude with an examination of the use of rewards in classrooms and how these can be substituted for working with students to identify and remove barriers to motivation and engagement.

Rewards in schools

The use of extrinsic rewards in schools and school systems is very deeply ingrained.

Many classroom teachers offer extrinsic rewards regularly as part of their behaviour management approach. From a very early age, students learn to please the teacher in order to be rewarded. Gold stars, lolly jars, student of the week, bonus points and free choice activities are offered as incentives. Teachers have been taught to do this; rewards are common practice. This diminishes the important intrinsic reward that comes from learning. Learning soon becomes more about work to please the teacher than personal growth and achievement.

When teachers are asked why they use extrinsic rewards, such as stickers, lollies, bonus points, or classroom parties, the answer is always the same. ‘The kids like them and they work!’

Questionable assumptions

There are several assumptions that can be questioned here, assumptions about efficacy and motivation.

  1.  ‘The kids like rewards!’ Just because someone likes something does not mean it is good for them, or that it helps them to learn. The more important question is whether rewards aid learning, and whether they offer a superior approach when compared to alternatives.
  2. Which kids like rewards? Obviously, the kids getting the rewards like it. There are very few people who don’t enjoy recognition, acknowledgement and being treated as a bit special. But what of those students who miss out? What of those students who are just as deserving but are not rewarded? How do they feel? Teachers are very busy watching the faces of the rewarded students and rarely notice the faces of the disappointed. Being disappointed repeatedly can be very demotivating.
  3. When teachers say the kids like rewards, one could ask ‘compared to what?’ Certainly, they could be expected to like getting rewards when compared to the option of not getting rewards. Who wouldn’t? But what about the option of getting rewards when compared to the option of discovering and experiencing the true joy of learning? Do the students have that reference point for comparison?
  4. What does it mean to say that the ‘rewards work’? Does this mean that student learning is enhanced by rewards? Or, does it mean that rewards encourage compliance? Most importantly, how do rewards improve learning compared to other approaches? As John Hattie is at pains to point out, nearly everything works in education; the real question is how well particular approaches enhance learning when compared to their alternatives.
  5. Rewards create energy for … more rewards. In an environment where rewards are common, so is the question ‘What do we get for doing this?’ In some cases, rewards can actually lower achievement, as students who are motivated by extrinsic rewards will do enough to get a reward, but no more, thereby artificially limiting their potential and motivation to achieve.
  6. Why are rewards necessary anyway? Do we really need to bribe people to do the right thing? Do people deliberately withhold best efforts and better methods waiting for the offer of a reward? Do students or teacher not try because they are hanging out for the reward to be offered? The answer to each of these questions is: ‘of course not!’
  7. An implicit assumption behind the offer of rewards is that people need rewards because they won’t do their best without them.

Myron Tribus makes explicit reference to the damage done by extrinsic motivators in his paper When Quality Goes to School.

Quality is what makes learning a pleasure and a joy.

You can increase some measures of performance by using strong external motivators, such as grades, prizes, threats and punishments, but the attachment to learning will be unhealthy.

It takes a joyful experience with learning to attach a student to education for life. Where there is joy in learning, the effort required does not seem like work.

Myron Tribus, When Quality Goes to School.


Intrinsic motivation in the classroom

Traditional didactic approaches to teaching do not promote intrinsic motivation. Some teachers churn through endless programs of plan-teach-assess in the hope that students will learn. If educators truly take to heart the need and moral obligation to unlock intrinsic motivation in learners, then a different approach is required. A more collaborative approach is needed.

Every learner is different, which adds enormously to both the joy and the complexity of teaching. The breadth and depth of prior knowledge varies, interests vary from student to student, as does the sense of belonging within a class or school. The home environment varies enormously too. Some families support and strongly encourage learning; others are less committed. How are teachers supposed to manage this variation? It can be extremely difficult to teach a class where the variation in knowledge and skills is measured in years of development.

The factors discussed in the previous two posts on motivation may be seen as requiring teachers to do even more than they do currently. How can teachers be expected to assess each factor on the model for each student for each learning activity and then respond to the findings? They cannot, it is too much to ask, even with small class sizes. This is not what we are advocating.

However, if teachers equip students to take responsibility for their learning and if teachers work with the students to adapt classroom processes, motivation and engagement can be continually improved.

Collaborating to remove barriers

Teachers and students can learn to work together in a more interdependent manner than the traditional student-teacher dependent relationship. This has been shown not to be additional work for teachers, just a different way of approaching their role. The key is to work with the students, which requires different relationships and the use of tools to support the collaboration.

As we pointed out in an earlier blog post, What the school improvement gurus are not yet talking about, students have an enormous contribution to make to school improvement.

This begins in the classroom, where students can work with the teacher to identify and remove barriers to motivation, engagement and learning. Students and teacher together explore the factors that enhance intrinsic motivation and engagement, and the degree to which they are evident in the school’s systems of learning. Together they develop and trial new tools and methods, make changes and observe the impact. In this way, they collaborate to study and improve the systems of learning that so profoundly affect them.

A Capacity Matrix is an example of a very useful tool. It helps learners understand what is to be learned and allows them to set goals and track progress.

Working with students to improve the system of learning opens new possibilities. Learning plans are routinely developed for students exhibiting special needs, but more recently there have been calls for all students to have individualised learning plans. Requiring teachers to develop the traditional individual learning plan for each of their students and then managing each plan is a practical impossibility. In the current system, teachers simply do not have the time to do this well for large numbers of students. But, there is nothing stopping students from learning how to develop and monitor their own individual learning plans.

Capacity Matrices can be used as the basis for individual learning plans for all students. Not only do the matrices make explicit what the students are expected to know, understand and be able to do, they significantly enhance intrinsic motivation.  By design, their use is consistent with the factors that enhance intrinsic motivation and improvement. Capacity matrices make the aim or Purpose clear, students are given Choice in how they go about their learning, the matrices are explicitly designed to develop and demonstrate Mastery, and students’ sense of Belonging in enhanced through collaboration, feedback and support.

Our website includes several Capacity Matrix templates and many Capacity Matrix examples.


How are you locking in your improvement gains?

We have worked with many schools over the last 15 years, each one committed and working really hard to continually improve. Yet our experience shows few have established an effective process to capture the many improvements they make. Organisational improvement is quickly lost where there is not a process in place to hold the gains made.

So what is your approach to capture organisational learning?

Ours is system documentation.

System documentation

System documentation is the term we use to describe a structured and disciplined approach to capture organisational knowledge, learning and improvement. It relates to a collection of key documents that reflect the way in which an organisation conducts its business.

Excellent system documentation:

  • provides a central repository of documents critical to the running of the organisation that are readily accessed and understood by everyone
  • has an easy-to-use format and structure that facilitates documentation, stakeholder involvement, and the capturing of organisation innovation and improvement
  • is regularly reviewed for effectiveness and efficiency
  • is easily maintained, updated and distributed
  • has one person assigned to oversee its ongoing review, consistency and improvement.

PDSA Cycle Ver1 28Jul10

System documentation: ‘the chuck under the continuous improvement wheel’

How to…

We have found the following structure for system documentation to be effective and efficient.

Page 22 - System Documentation Structure Ver3 23Jan14

Suggested components of system documentation

Usually in electronic form, the documentation comprises:

  • school directional and planning documents
  • processes (procedures) describing methods, sequencing and responsibilities
  • policies describing what the organisation will do with respect to a particular endeavour and why (policies relate to processes and supporting documents)
  • supporting documents – standard documents pertaining to a specific process or policy, including: templates, letters, forms, presentations, etc.
  • records – documents containing data, facts, information and/or evidence relating to the organisation’s operations
  • document control which facilitates the identification and locating of documents and ensures people have the latest version of the right document.

We believe there are several key steps to getting started with system documentation:

  1. Assign one person to oversee the design, implementation and improvement of the system documentation process.
  2. Agree a structure and index and establish folders.
  3. Place all existing processes, policies and supporting documents into the folders (they will quickly accumulate and can reviewed later on).
  4. Agree a format for processes, policies and supporting documents
  5. Agree and document a document control policy and associated processes (how will documents be uniquely identified?).
  6. Begin by documenting a new process, related policy and supporting document that will immediately add value or reduce risk. Involve key stakeholders to build ownership and understanding.
  7. Encourage people to document processes, policies and supporting documents as they engage with them to build the system over time.

The benefits

There are many benefits to having effective system documentation. These include:

  • Increased accessibility to important documents. (Often in schools, these documents are scattered across different people’s computers, or worse still; are to be found only in the heads of those who left the school last year!)
  • Openness, transparency and accountability
  • Effective communication
  • The basis for inducting, training and mentoring staff and other stakeholders
  • Consistency of approach (agreement as to ‘our best known way’)
  • Providing the foundation necessary for ongoing reflection, review, continual improvement and innovation.

Learn more…

View a video clip on system documentation.

Purchase a System Documentation Guide

Register to receive updates on other Quality Learning resources

Register to receive updates on the forthcoming Quality Learning book – Improving Learning: learning a guide to school improvement

Human Motivation 3: Mastery and Belonging

This is the third of four blog posts to explore human motivation, and how we can encourage learners’ intrinsic motivation and engagement. These posts are edited extracts from our forthcoming book: Improving Learning: A how-to guide for school improvement.

Over the past decade we have drawn upon a wide range of research as well as our own experience to develop the following framework of factors that can enhance intrinsic motivation and engagement.

In the previous post, we explored this framework with a focus on the first two key factors: purpose and choice. In this post we discuss the other two key factors, namely mastery and belonging.

Factors that enhance intrinsic motivation and engagement: Purpose, Choice, Mastery, Belonging

Factors that enhance intrinsic motivation and engagement

Purpose

Meaning

Advancing my interests and passions. Making a positive difference to me or others

Relevance

Pertinent to me, my situation and my future

Possibility

Accepting what is to be accomplished and uncovering the potential of what could be achieved

Choice

Responsibility

Committing to the task. Experiencing a sense of authority. Being relied upon by others

Autonomy

Selecting methods and resources, defining quality standards and determining time-lines and milestones

Creativity

Exploring and expressing thoughts, skills, imagination and individuality

Mastery

Challenge

Finding the task interesting, compelling and achievable

Achievement

Monitoring one’s own progress and performance. Celebrating learning and success

Learning

Trying things, making mistakes, developing new skills and finding different ways of thinking

Belonging 

Collaboration

Enjoying interdependence, working towards shared goals and experiencing authentic teamwork

Feedback

Giving and receiving constructive feedback and encouragement

Support

Recognising skills and abilities in one’s self and others. Sharing, helping, learning together. Being free of fear

Factors that enhance intrinsic motivation and engagement


The factors identified in this framework are generic in that they apply, to varying degrees, to everyone. It is a model of common causes. By building these into our systems, we tap into intrinsic motivation.

Let’s look more closely at the last two groups of factors…

Promote mastery

Mastery is about building capacity, capability and competence. In order to develop mastery an individual needs to: be challenged (just the right amount, not too much, not too little), monitor and celebrate their achievements, and learn as they go.

Challenge

For an activity to pose any challenge, it must be interesting to those doing it. Without interest there can be no challenge. (Note that interest is different to relevance and meaning).

Activities that place too much demand on the skills and abilities of an individual can lead to a loss of interest because the activities are deemed to be too difficult and the outcome unachievable. Activities that place insufficient demand are deemed boring.

Getting the level of challenge just right can make a task compelling: unlocking high levels of intrinsic motivation. (Vygotsky referred to this as the zone of proximal development).

The right degree of challenge, with interest, can be a motivator. Too much challenge or too little challenge can be a de-motivator.

Achievement

Monitoring one’s own performance, and celebrating growth and accomplishments along the way, is what achievement is all about. Seeing progress can be highly motivating; to fail to see progress can be de-motivating.

Learning

Everyone is born with a passion for learning. Learning is as natural as breathing. Humans find great joy in trying new things, developing new skills, building on existing capabilities and exploring new ways of thinking. Learning contributes greatly to one’s sense of mastery and can be a powerful intrinsic motivator.

Foster a sense of belonging

The factors that comprise belonging are different in nature to the three previous groups: purpose, choice and mastery. They all relate in some way to the relationship between the individual and the activity: can the individual see purpose in the activity, are they afforded choice as they approach the activity and does the activity build mastery?

This set of factors recognises that humans are social beings and that a good deal of learning goes on in a social context: in a social system. Also, we have a deeply felt need to belong and to feel connected to others. There are factors within social systems that can enhance motivation and others that can suppress motivation. These factors relate to a sense of belonging.

Collaboration

The joy that comes from working closely and effectively with others towards a shared goal can be highly motivating. It takes time, skill and effort to learn to work with others in a truly cooperative manner. When this is achieved, the results can be spectacular and the experience highly memorable. There is little doubt that much more can be achieved working in collaboration with others than can be achieved working alone.

Feedback

Feedback is an essential feature of every self-regulating system. Knowing where we are, where we would prefer to be, and immediately using the comparison of these two pieces of information to decide what to do next is critical to our sense of wellbeing.

In a social system, individuals give each other signals (feedback) that can be used to adapt behaviour and performance. Where this is done in a caring, constructive and encouraging manner, it can fan the flame of intrinsic motivation. Where feedback is given in a critical, malicious or spiteful way, it can be dispiriting and deeply de-motivating.

Learning can be accelerated with feedback. When a teacher works with a student to help them reflect upon the task, their learning processes and their metacognitive approaches, this feedback can significantly improve learning. Similarly, when students provide constructive feedback to a teacher about how their teaching is affecting their learning, this feedback can be of enormous value to the teacher. Such feedback enhances an individual’s capacity to manage their learning, which is highly motivating.

Support

Recognising the contribution, progress and abilities of others is a first step in offering support to them. Offering to share, help and learn together can significantly boost the motivation of an individual.


In the next post in this series, we examination of the use of rewards in classrooms. We also discuss how these can be substituted for working with students to identify and remove barriers to motivation and engagement.

We encourage you to discuss these ideas with your colleagues. If you are a teacher, you may wish to explore these concepts with your students. If you are really game, you may like to ask your students (and colleagues) the degree to which these factors are evident within your systems of learning. Furthermore, you could seek suggestions regarding improvements to the systems of learning to enhance motivation and engagement.


May the force be with you!

The Forcefield Analysis is another important tool in our quality improvement toolbox. It helps us to focus on getting the right things right.

Forcefield Analysis
Forcefield Analysis

A Forcefield Analysis is used to examine the forces driving and inhibiting progress in any area of endeavour. It was developed by Kurt Lewin. Lewin was one of the most influential social psychologists of the 20th century, recognised for his pioneering work in organisation dynamics and change.

The theory is based upon an understanding that our organisations exist in a state of equilibrium. Driving and restraining forces ‘hold’ the organisational system in the observed steady state. If we wish to move the system to a new state, we must alter the forces acting on the system and shift the equilibrium.

And here’s the most important point when it comes to improving systems:

We derive a greater return on our improvement efforts by working to minimise the restraining forces, than by increasing the driving forces.

Of course, applying effort to maintain the driving forces is important. However, the restraining forces represent the longest levers to improvement.

Once the restraining forces are identified, the relative contribution of each can be established. This can be achieved through further data collection, or by working with the people with the greatest understanding of the area under study.

We offer a couple of examples to illustrate this in practice.

Force-Field Analysis of the factors driving and preventing a perfect class

The first Forcefield Analysis was developed by students working with their teacher to improve their classroom. Together they brainstormed the forces they believed were helping to create a perfect learning environment, and then, the forces preventing this desired state. They then used Multi-voting; each student applied three votes (star stickers) to the list of preventing forces. A ‘lack of self-control’ was the preventing force they agreed was having the greatest negative effect. They then went on to agree how they could work on their self-control – with great results!

Force-Field Analysis of individuals' experience of change
Force-Field Analysis of individuals’ experience of change

In this second example, we used the Forcefield Analysis in a workshop to explore participants’ experience of change. They used pink sticky notes to record what they believed were the driving forces of successful change, and yellow sticky notes to document the forces they believed inhibited change efforts. An Affinity Diagram was used to identify the themes of both the driving and inhibiting forces. The themes were arranged in order of the frequency in which they occurred, as a Pareto Chart. This was a most insightful exercise; helping participants to reflect on, and improve, their improvement efforts. They identified steps they can take to ensure that the greatest restraining forces are minimised in planning future change processes.

How to

  1. Use poster size paper (or smaller for individual use) with sticky notes or write directly onto the paper.
  2. Draw up a Forcefield Analysis template. Write down the goal. Divide the page into two columns. Label each column, one driving forces and the other restraining forces:

    Forcefield Analysis Template
  3. Brainstorm a list of the driving forces.
  4. Brainstorm a list of the restraining forces.
  5. Prioritise the restraining forces using Multi-voting and/or an Interrelationship Digraph. (You may need to collect data to do this well!)
  6. Develop a plan to overcome the prioritised restraining force/s.

Find out more…

Learn more about Quality Learning tools.

Purchase a Tool Time for Education or Tool Time for Business recipe book.

We’d love to hear about your experiences using the Forcefield Analysis tool. Please comment.

Human Motivation 2: Purpose and Choice

This is the second of four blog posts to explore human motivation, and how we can enhance learners’ intrinsic motivation and engagement. These posts are edited extracts from our forthcoming book: Improving Learning: A how-to guide for school improvement.

In this post we discuss the personal nature of human motivation and introduce a framework of factors to enhance learners’ intrinsic motivation and engagement. We focus upon the first two key factors, namely purpose and choice, as keys to unlocking intrinsic motivation and engagement.

Motivation is personal

One of the biggest challenges in coming to understand human motivation is the highly personal nature of it. Something you may find compelling others find tedious. The factors that enhance my motivation can be very different to those that enhance yours. Factors that demotivate me may have little effect on you.

The rewards and threats of punishments needed to stimulate action vary enormously from person to person too. Factors that drive deep engagement also vary.

How can teachers be expected to motivate their students? How can principals be expected to motivate their teachers? How can anyone be expected to motivate another individual? In short, they cannot!

How can anyone be expected to motivate another individual? In short, they cannot!
We simply cannot motivate others.

Despite this fact, most of us have been taught that a key aspect of a leader’s job is to motivate others. This is particularly true of teachers, which is unfortunate. While teachers can certainly inspire, support, encourage and mediate the learning of their students, they cannot motivate them. However, the systems and processes they put into place in their classrooms can de-motivate them.

High degrees of engagement and intrinsic motivation come from the drive within each individual. Yet, we continue to build extrinsic motivation factors, such as rewards and punishments, into the structure and operation of our systems. In doing this, we damage intrinsic motivation.

If it is not possible to compel others to become engaged, how can we maximise engagement and intrinsic motivation?

Teachers manage systems of learning. In order to maximise motivation and learning, teachers need to identify and remove the de-motivators: the barriers to learning, and create a systemic environment that maximises the factors that unlock intrinsic motivation and enhance learning.

Over the past decade we have drawn upon a wide range of research as well as our own experience to develop the following framework of factors that can enhance intrinsic motivation and engagement. This model draws on the work of Deming, Kohn, Herzberg, Langford, Scholtes, Senge, Pink and Hattie.

Factors that enhance intrinsic motivation and engagement

Purpose

Meaning

Advancing my interests and passions. Making a positive difference to me or others

Relevance

Pertinent to me, my situation and my future

Possibility

Accepting what is to be accomplished and uncovering the potential of what could be achieved

Choice

Responsibility

Committing to the task. Experiencing a sense of authority. Being relied upon by others

Autonomy

Selecting methods and resources, defining quality standards and determining time-lines and milestones

Creativity

Exploring and expressing thoughts, skills, imagination and individuality

Mastery

Challenge

Finding the task interesting, compelling and achievable

Achievement

Monitoring one’s own progress and performance. Celebrating learning and success

Learning

Trying things, making mistakes, developing new skills and finding different ways of thinking

Belonging

Collaboration

Enjoying interdependence, working towards shared goals and experiencing authentic teamwork

Feedback

Giving and receiving constructive feedback and encouragement

Support

Recognising skills and abilities in one’s self and others. Sharing, helping, learning together. Being free of fear

Factors that enhance intrinsic motivation and engagement

Factors that enhance intrinsic motivation and engagement: Purpose, Choice, Mastery, Engagement
Factors that enhance intrinsic motivation and engagement

The factors identified in this framework are generic in that they apply, to varying degrees, to everyone. It is a framework of common causes. By building these into our systems we tap into intrinsic motivation.

Let’s look more closely at the first two groups these factors…

Create purpose

Of the four groups of factors that can enhance motivation and engagement, purpose is perhaps the most personal. Purpose relates to the nature of the task. Things that abound with meaning, relevance and possibility for one person can be totally devoid of purpose for another.

Meaning

Activities that tap into an individual’s interests and passions result in greater drive than activities that do not. Most people are driven to do things that will make a positive difference for themselves and in their own lives. Most individuals also derive meaning from making a positive difference for others in the world. Finding a sense of meaning in a task or activity can be a strong motivator. Meaning inspires passion and commitment. Meaning unlocks intrinsic motivation.

Relevance

To be driven to action, that action needs to bear some relation to the life of the individual. Actions that accord to the circumstance and needs of the individual provide greater intrinsic motivation than those that do not. Lack of relevance is a de-motivator; ask any teenager (or teacher participant of a professional learning workshop!).

Possibility

Possibility relates to the extent to which an individual uncovers and ‘buys into’ a vision of what might be possible. As a first step, the potential of an activity must be clearly understood and accepted. What could be the benefit of this? What would it look like to do this superbly well? Failing to see the possibility in a task is usually de-motivating.

Collectively, these three factors – meaning, relevance and possibility – help the individual understand: what is to be done, why it should be done, how it relates to the individual and the individual’s future, what can be achieved, and how pursuit of the activity matters in the larger scheme of things.

Provide choice

These factors relate to the extent to which the individual has a sense of control over tasks. These factors consider the degree to which the task offers the opportunity to practice responsibility, enhance skills of self-management, and exercise creativity and self-expression. Not feeling in control leads to anxiety. Anxiety is a major barrier to intrinsic motivation and learning.

Responsibility

Being given the authority to get the job done and doing what it takes to do the job well is what responsibility is all about.

Following someone else’s directive is very different to accepting responsibility. Some managers complain that their employees don’t accept responsibility. Parents and teachers make the same complaint about children. Some principals complain about teachers. What they are frequently saying is that people will not do as they are told, rather than people are failing to exercise responsibility!

Being afforded the authority to engage with a whole task, not just bit of it, and developing a sense of being needed by others can enhance motivation. Not being given the authority necessary to take responsibility is de-motivating.

Autonomy

While responsibility is about accepting one’s role in the completion of an activity, autonomy is about exercising choice regarding the activity itself and in how the activity is handled.

To act autonomously is to make choices about the activities, methods and resources to be used, which include establishing a schedule and then self-managing that schedule. To act autonomously is also to participate in defining the quality standards – the criteria by which the quality of the activity will be measured.

With autonomy comes a sense of control. Exercising autonomy can unlock intrinsic motivation.

Creativity

Creativity goes beyond taking on a task and choosing how it will be managed, into the realm of individual expression. The freedom to explore one’s own imagination, thoughts and skills in applying them to a task can be highly motivating.

Mastery and Belonging

In subsequent blog posts, we will expand upon the remaining two groups of factors – Mastery and Belonging – and contrast the use of reward in classrooms with identifying and removing barriers to learning and  improvement.

Until then, we encourage you to discuss these ideas with your colleagues. If you are a teacher, you may wish to explore these concepts with your students. If you are really game, you may like to ask your students (and colleagues) the degree to which these factors are evident within your systems of learning. Furthermore, you could seek suggestions regarding improvements to the systems of learning to enhance motivation and engagement.

If you have observations, suggestions or questions, please share your comments!