Social Systems and Interactions
There are many types of systems. Social, mechanical, biological, and ecological systems are examples. This post explores the key features of social systems and their implications for leaders of organisations of all types.
Systems
Let’s start with a definition.
A system is a network of interdependent components that work together to try to accomplish the aim of the system.
Edwards Deming, 1994, The New Economics: For industry, government and education, MIT, Massachusetts, p. 5
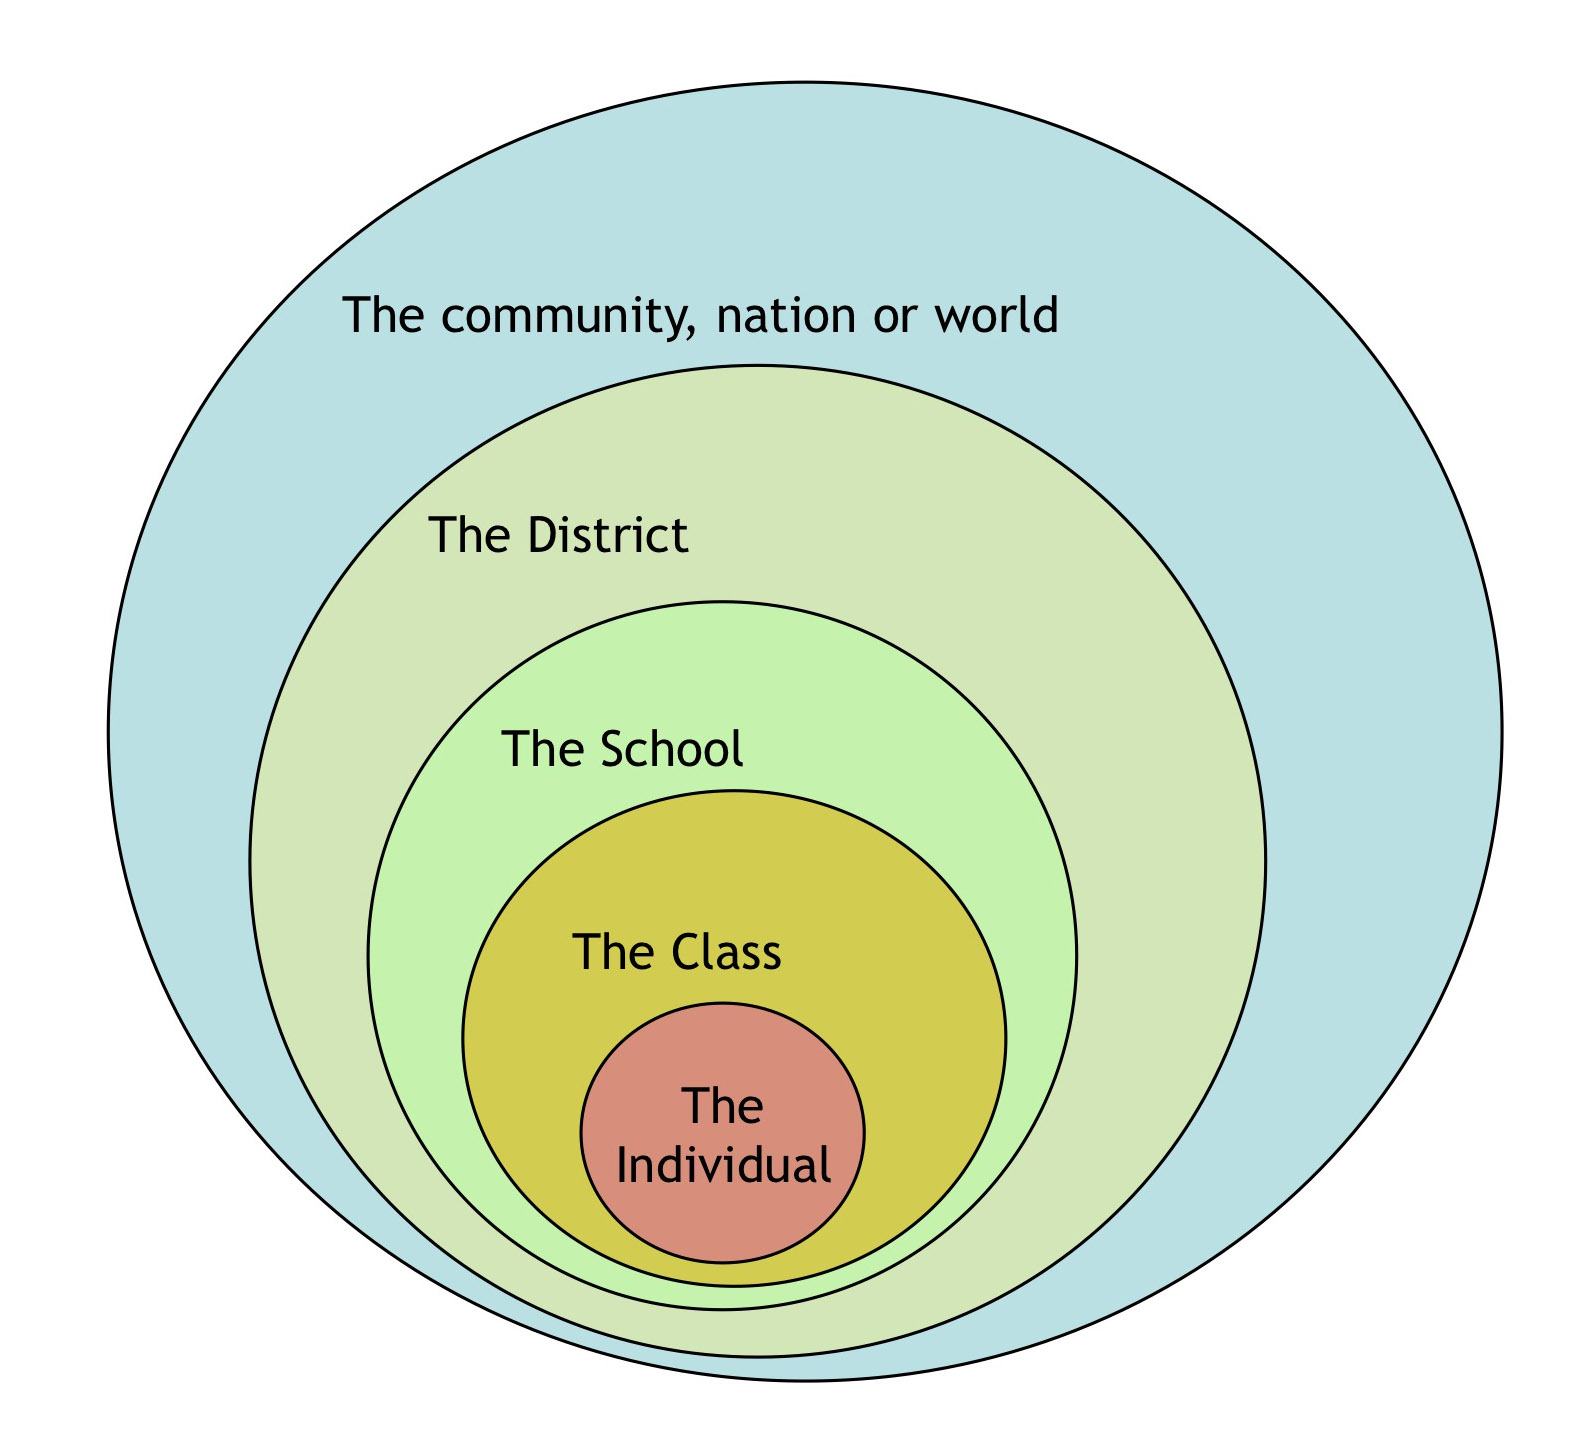
A key feature of systems is interdependence among the elements comprising the system. Another key feature is that systems can nest and be contained within other systems.
To illustrate, the human body is a system of interdependent components. Within the containing system of the human body there are systems such as the nervous, respiratory and circulatory systems. These systems are clearly interdependent.
Social Systems
Social systems are a specific type of system that exhibit four unique characteristics:
- A social system can choose its purpose.
- A social system can choose the methods by which it will seek to achieve its purpose.
- Elements within a social system can also choose their purpose.
- Elements within a social system can choose the methods by which they seek to achieve their purpose.
These characteristics explain why organisations are such dynamic and complex systems to manage and lead.
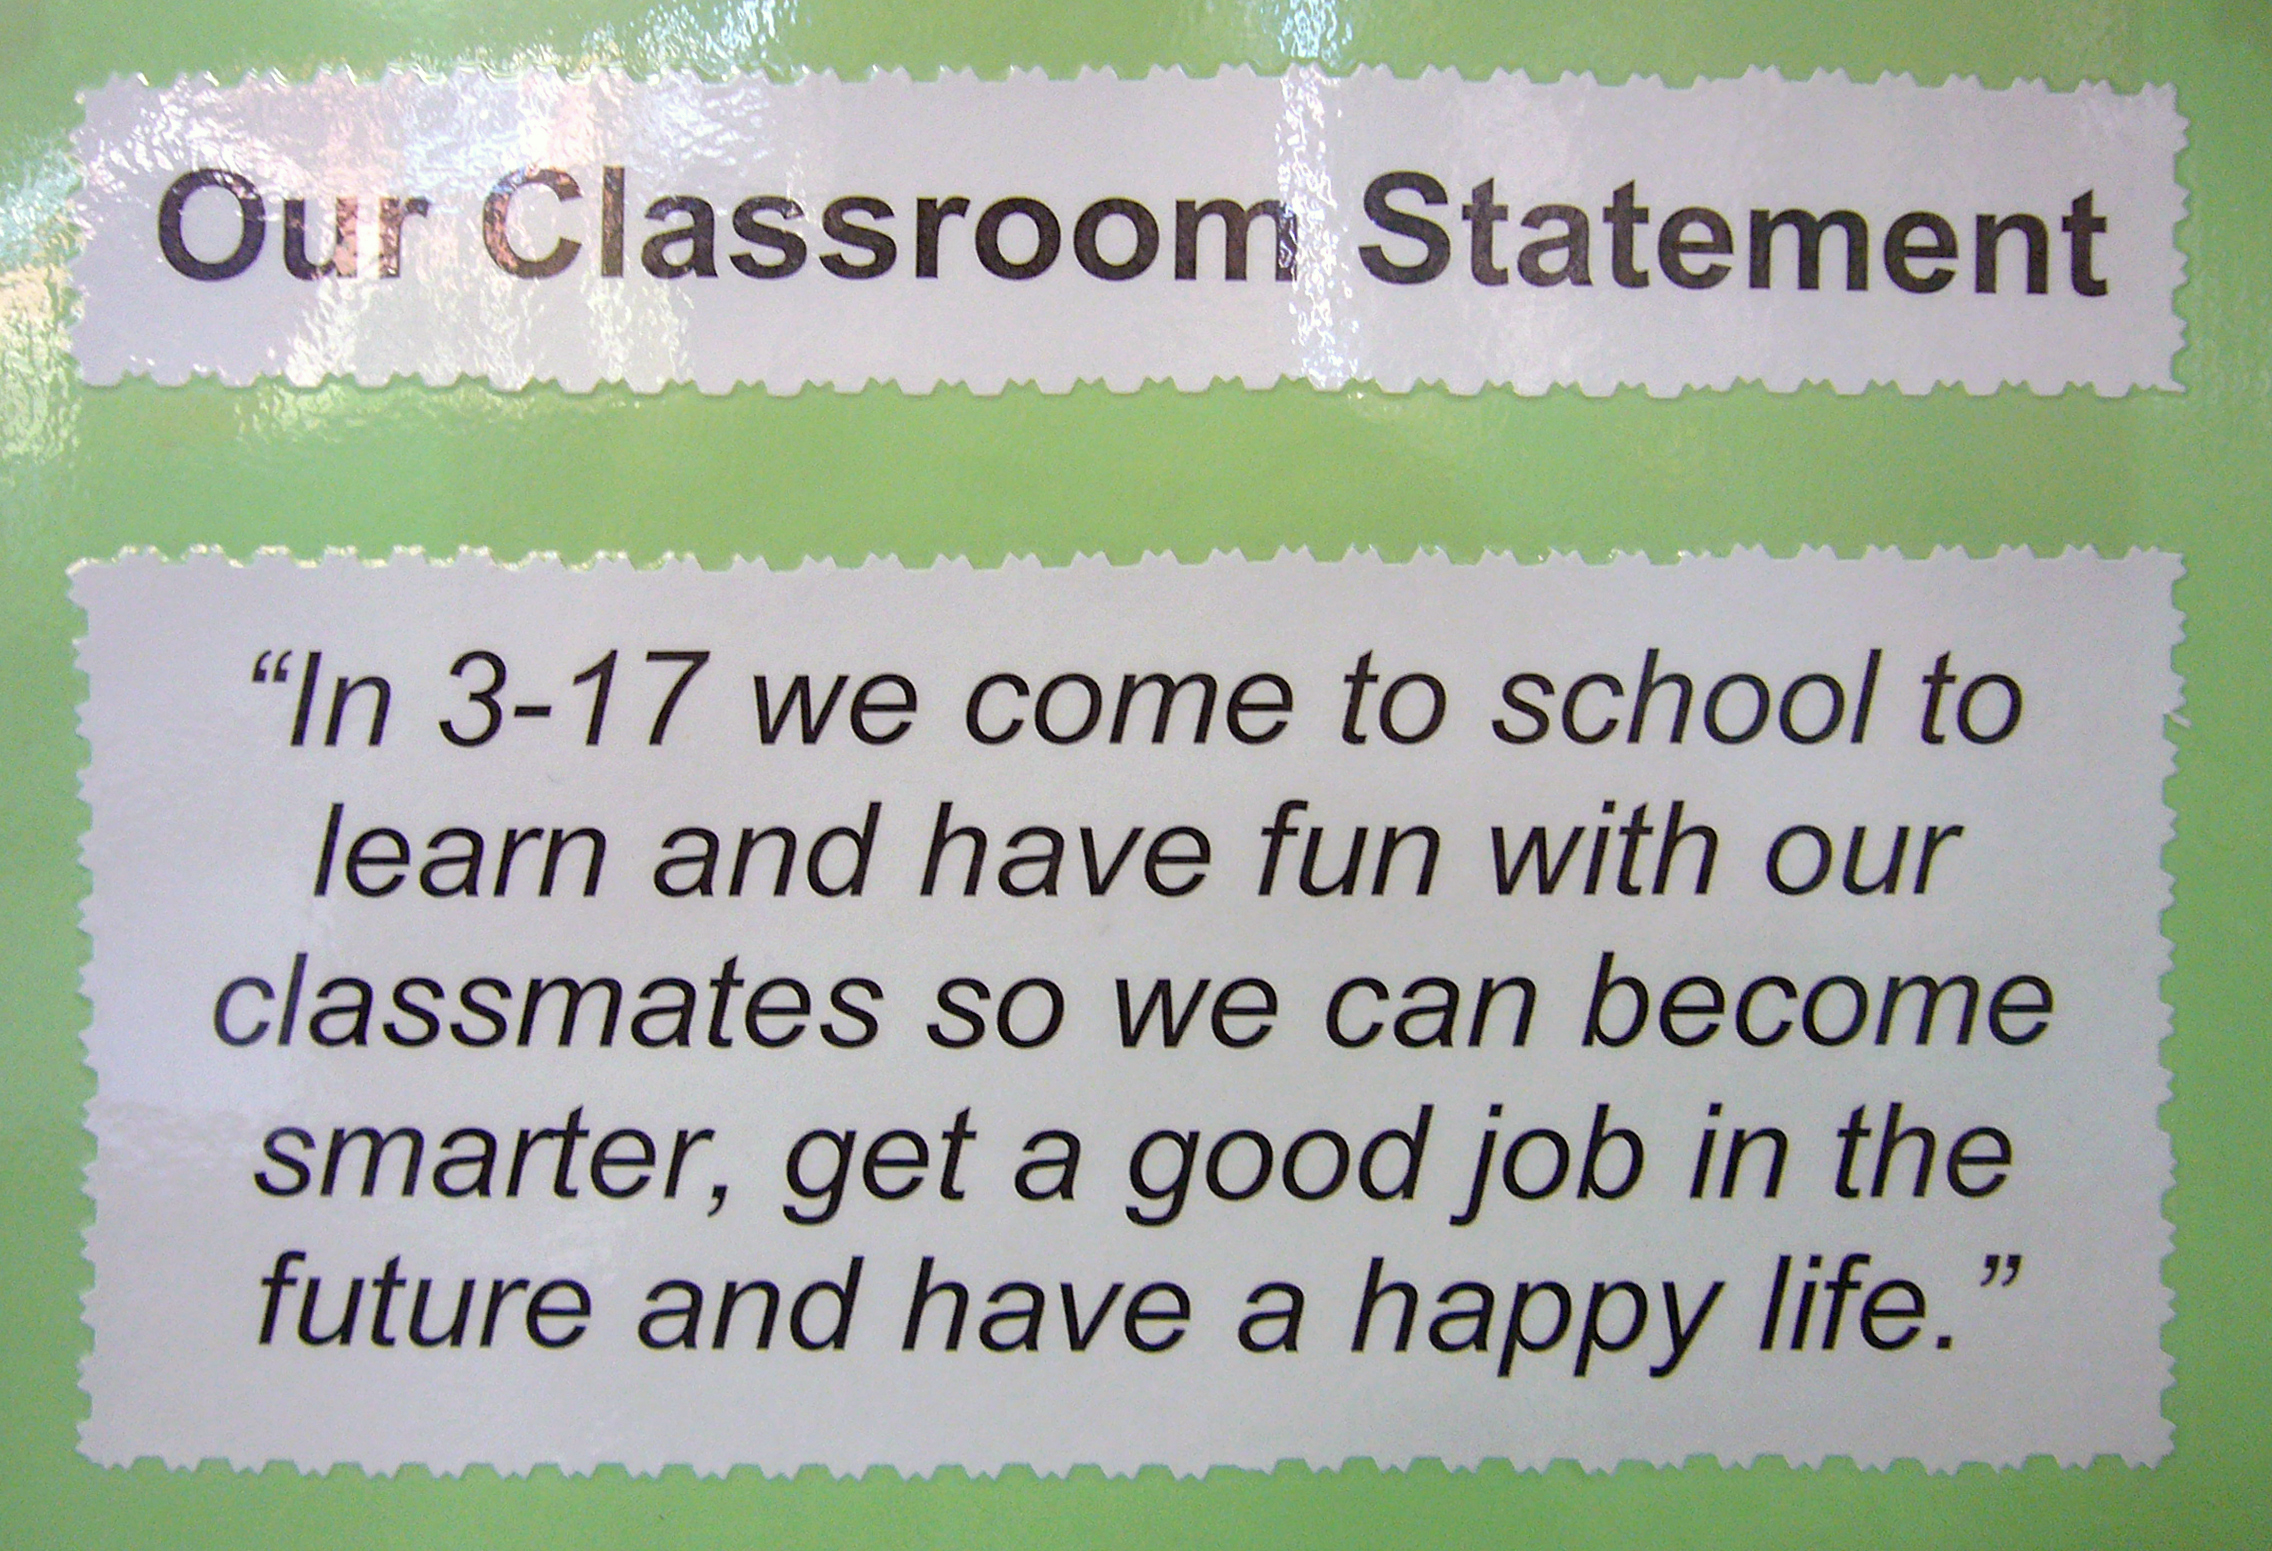
Consider a school, for example. A school is a social system. Within the context of the local education system and its community, a school chooses both its purpose and how it proposes to achieve its purpose. Figure 2 shows the purpose statement for Wanniassa Hills Primary School in the ACT. The school consulted extensively with parents, students and staff over the past few months to discover and document this purpose statement.

Within a school, the various faculties and teams also choose their purposes and methods to achieve them. For the school to optimise its efforts, the aims and methods of the individuals and teams need to align to those of the school as a whole.
Many teachers and school leaders can share stories of individuals and groups within a school not being aligned with the aspirations of the school community as a whole. It can be very frustrating for everyone.
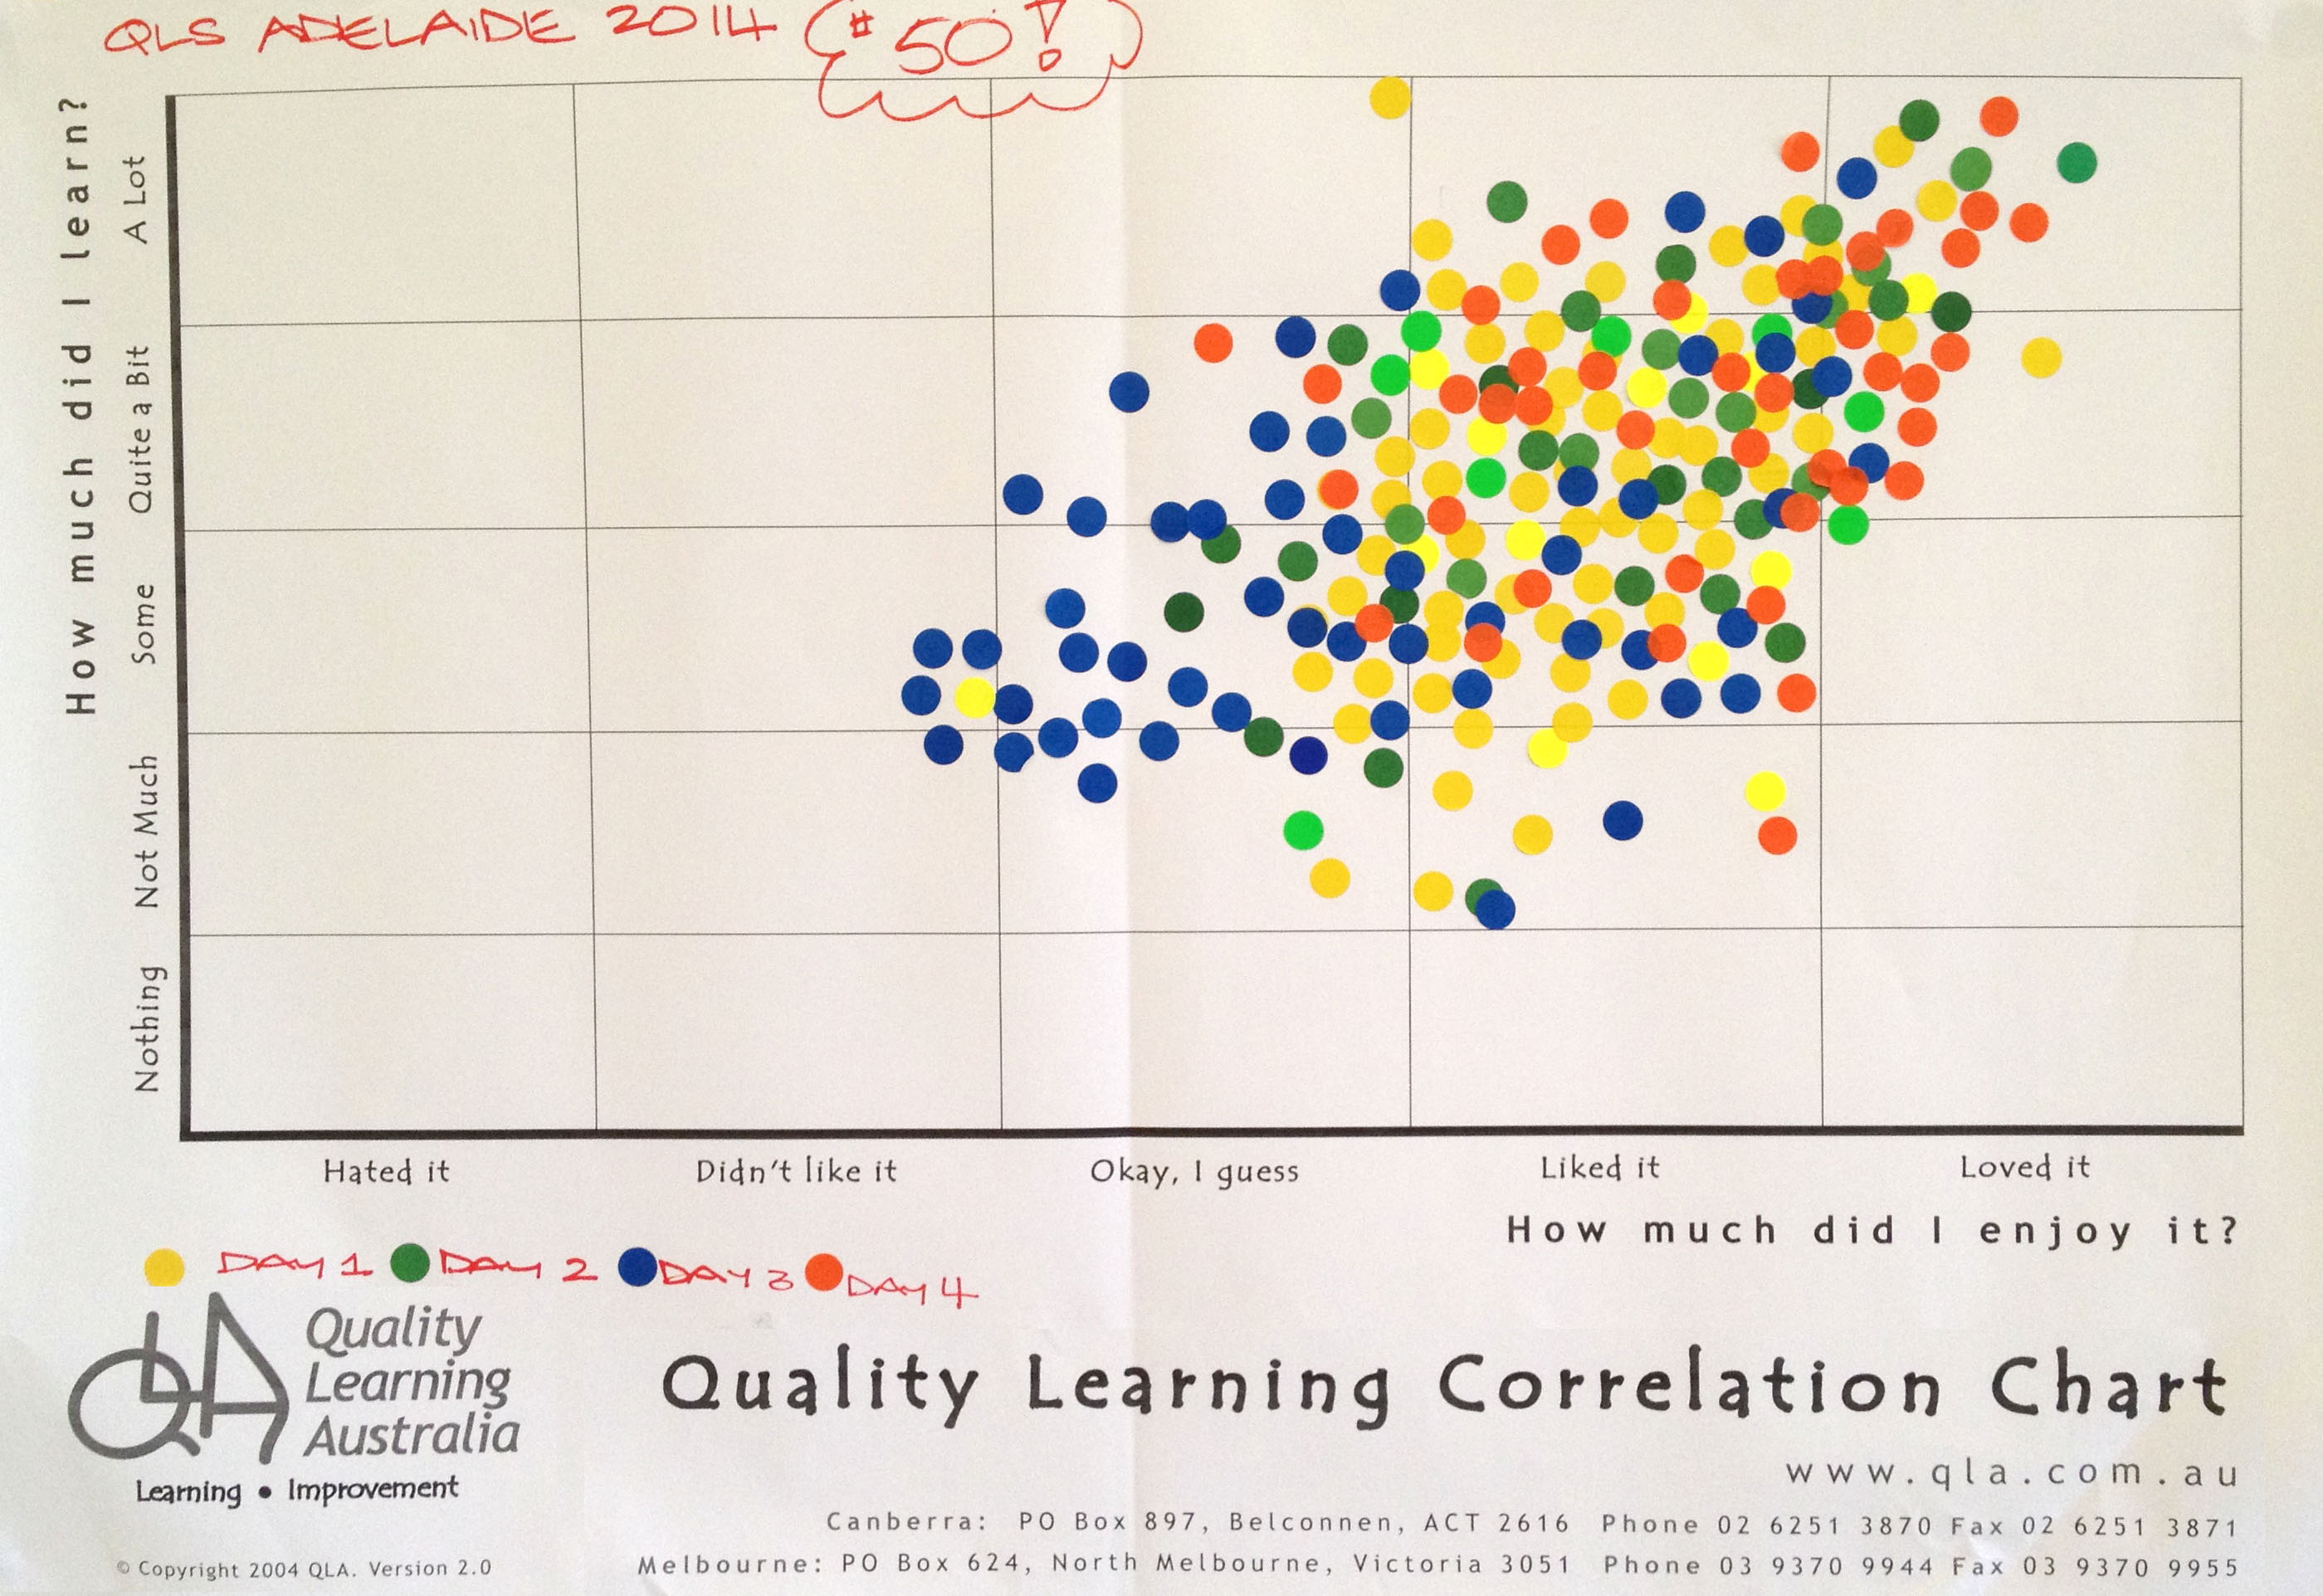
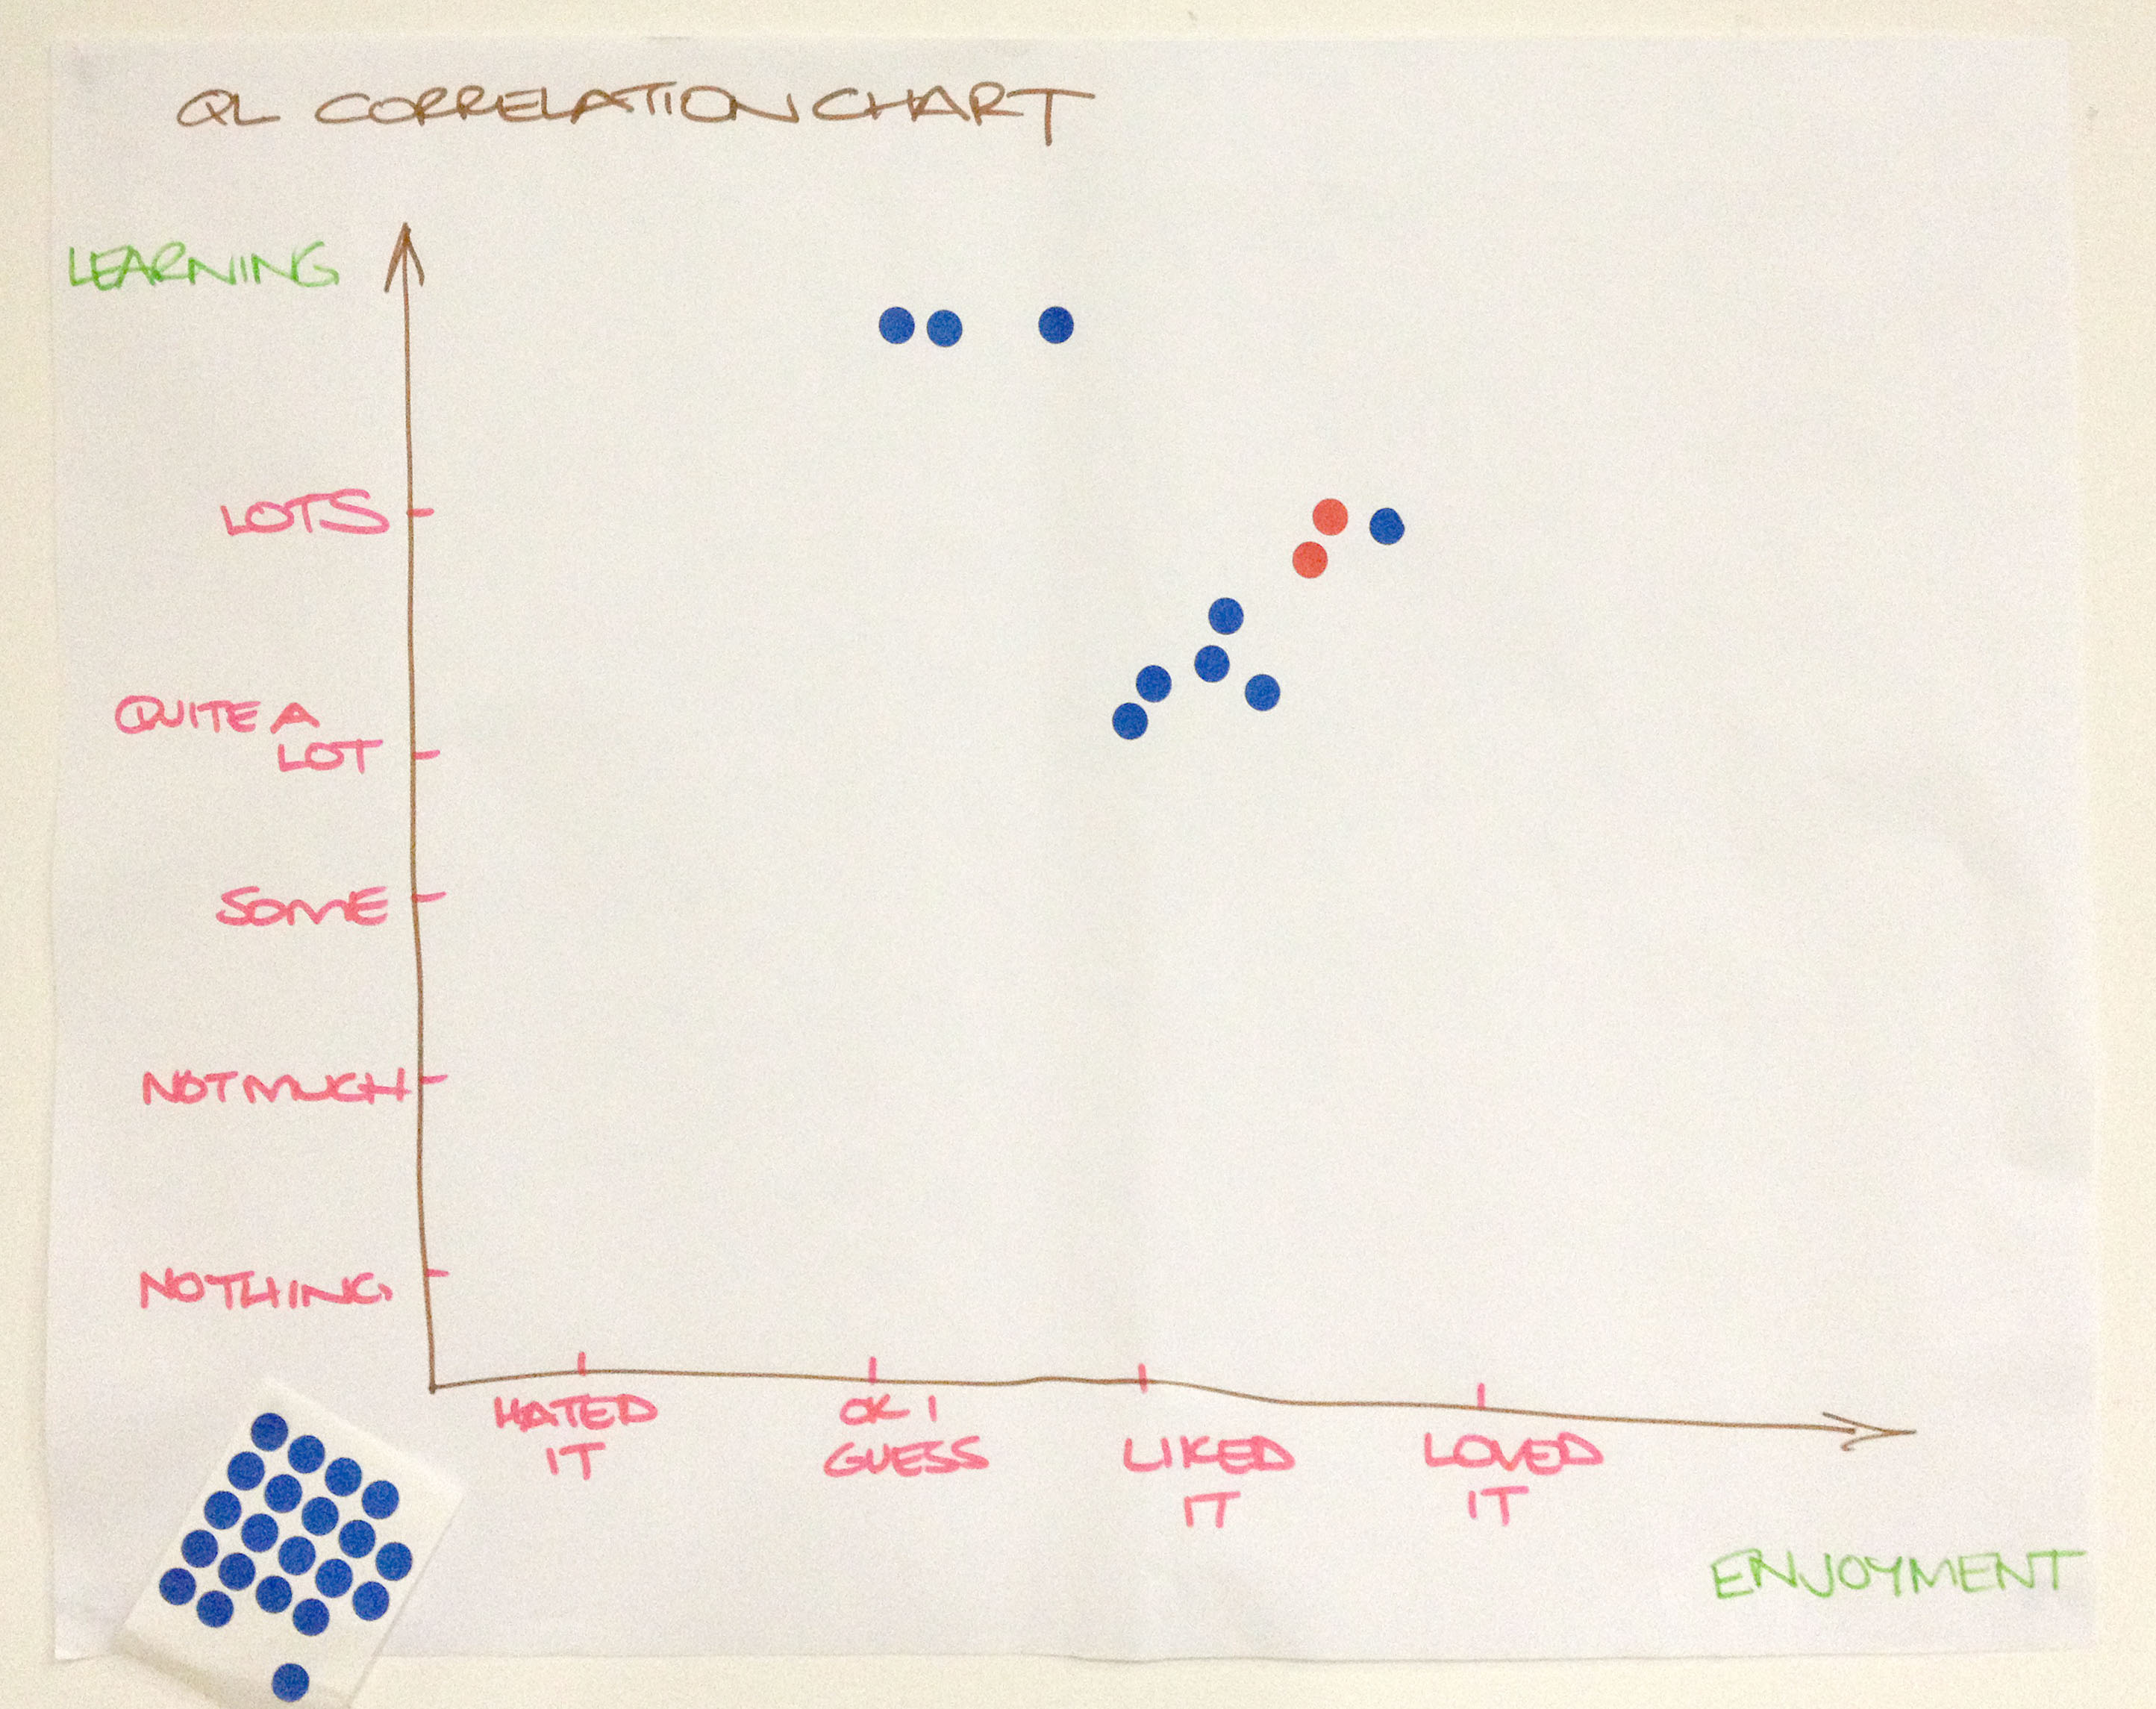
Similarly a class is a social system. The class can choose its purpose, like that shown in Figure 3. The class can also choose how it will seek to fulfil its purpose. Within a class, individual students and groups of students choose their purpose and how they wish to go about it. This is evident from moment to moment as students may choose to ‘tune in’ or engage in disruptive behaviour.
In summary:
The system as a whole chooses purpose and methods, as do elements within the system. To optimise the efforts of a school, the purpose and methods of the individuals and groups within the school need to align to that of the school as a whole. The same applies to classrooms.
Interaction effects
A key reason organisations are such dynamic and complex entities is the impact of interactions among the elements. The interactions among members of a class and the interactions among teachers and groups of teachers are two examples of these interaction effects.
As the number of people in an organisation increases, the number of potential interactions increases exponentially. In fact, the impact of interaction effects becomes way more dominant than the impact of individuals within the organisation.
The interactions among individuals and groups can be positive and add to the performance of the whole. They can also be negative and detract from performance.
Interactions can lead to harmony, and they can lead to discord.
This is self evident to most teachers and school leaders who have worked in a variety of schools, from those with a tired and cynical culture to the vibrant and collaborative team.
Interaction may reinforce efforts, or it may nullify efforts.
Edwards Deming, 2012, The Essential Deming: Leadership Principles from the Father of Quality, edited by Joyce Orsini, McGraw-Hill, New York, p. 78.
Interactions dominate the behaviour and performance of social systems. Consequently, the behaviour and performance of a classroom, workgroup or organisation is much more heavily influenced by the interaction among people than by the direct impact of each individual. This is why creating a school climate that promotes caring and productive relationships is so important.
Conclusion
Schools are complex, dynamic and highly relational social systems. The interdependence among the individuals and groups within schools and the interactions among them, are key determinants of the culture, behaviour and performance of the school. The same applies to classrooms.
It is incumbent on leaders, therefore, to ensure that system and processes promote positive interactions with purposeful and harmonious relationships.
Learn more about the theory behind the Quality Learning approach in our book Improving Learning: A how-to guide for school improvement.
Watch a video case study of a year 2 class working to ensure their classroom system is purposeful and harmonious.
Read a previous post discussing the obligations of managers to continually improve the systems and processes for which they are responsible.