Tools to improve the quality of learning
Educators can get very excited by Quality Learning tools. In this post we explore these tools and how to use them most effectively.

What is a Quality Learning tool?
Let’s start with a definition of any tool.
A tool is a physical or procedural instrument.
A hammer is a tool, a physical instrument for driving nails. A to-do list is a tool, a procedural instrument for helping us remember what we have to get done. The internet is a tool that requires both a physical instrument (computer or smart phone) and procedures to follow to connect and gain access to information.
A Quality Learning tool is a physical or procedural instrument used to improve the quality of learning.
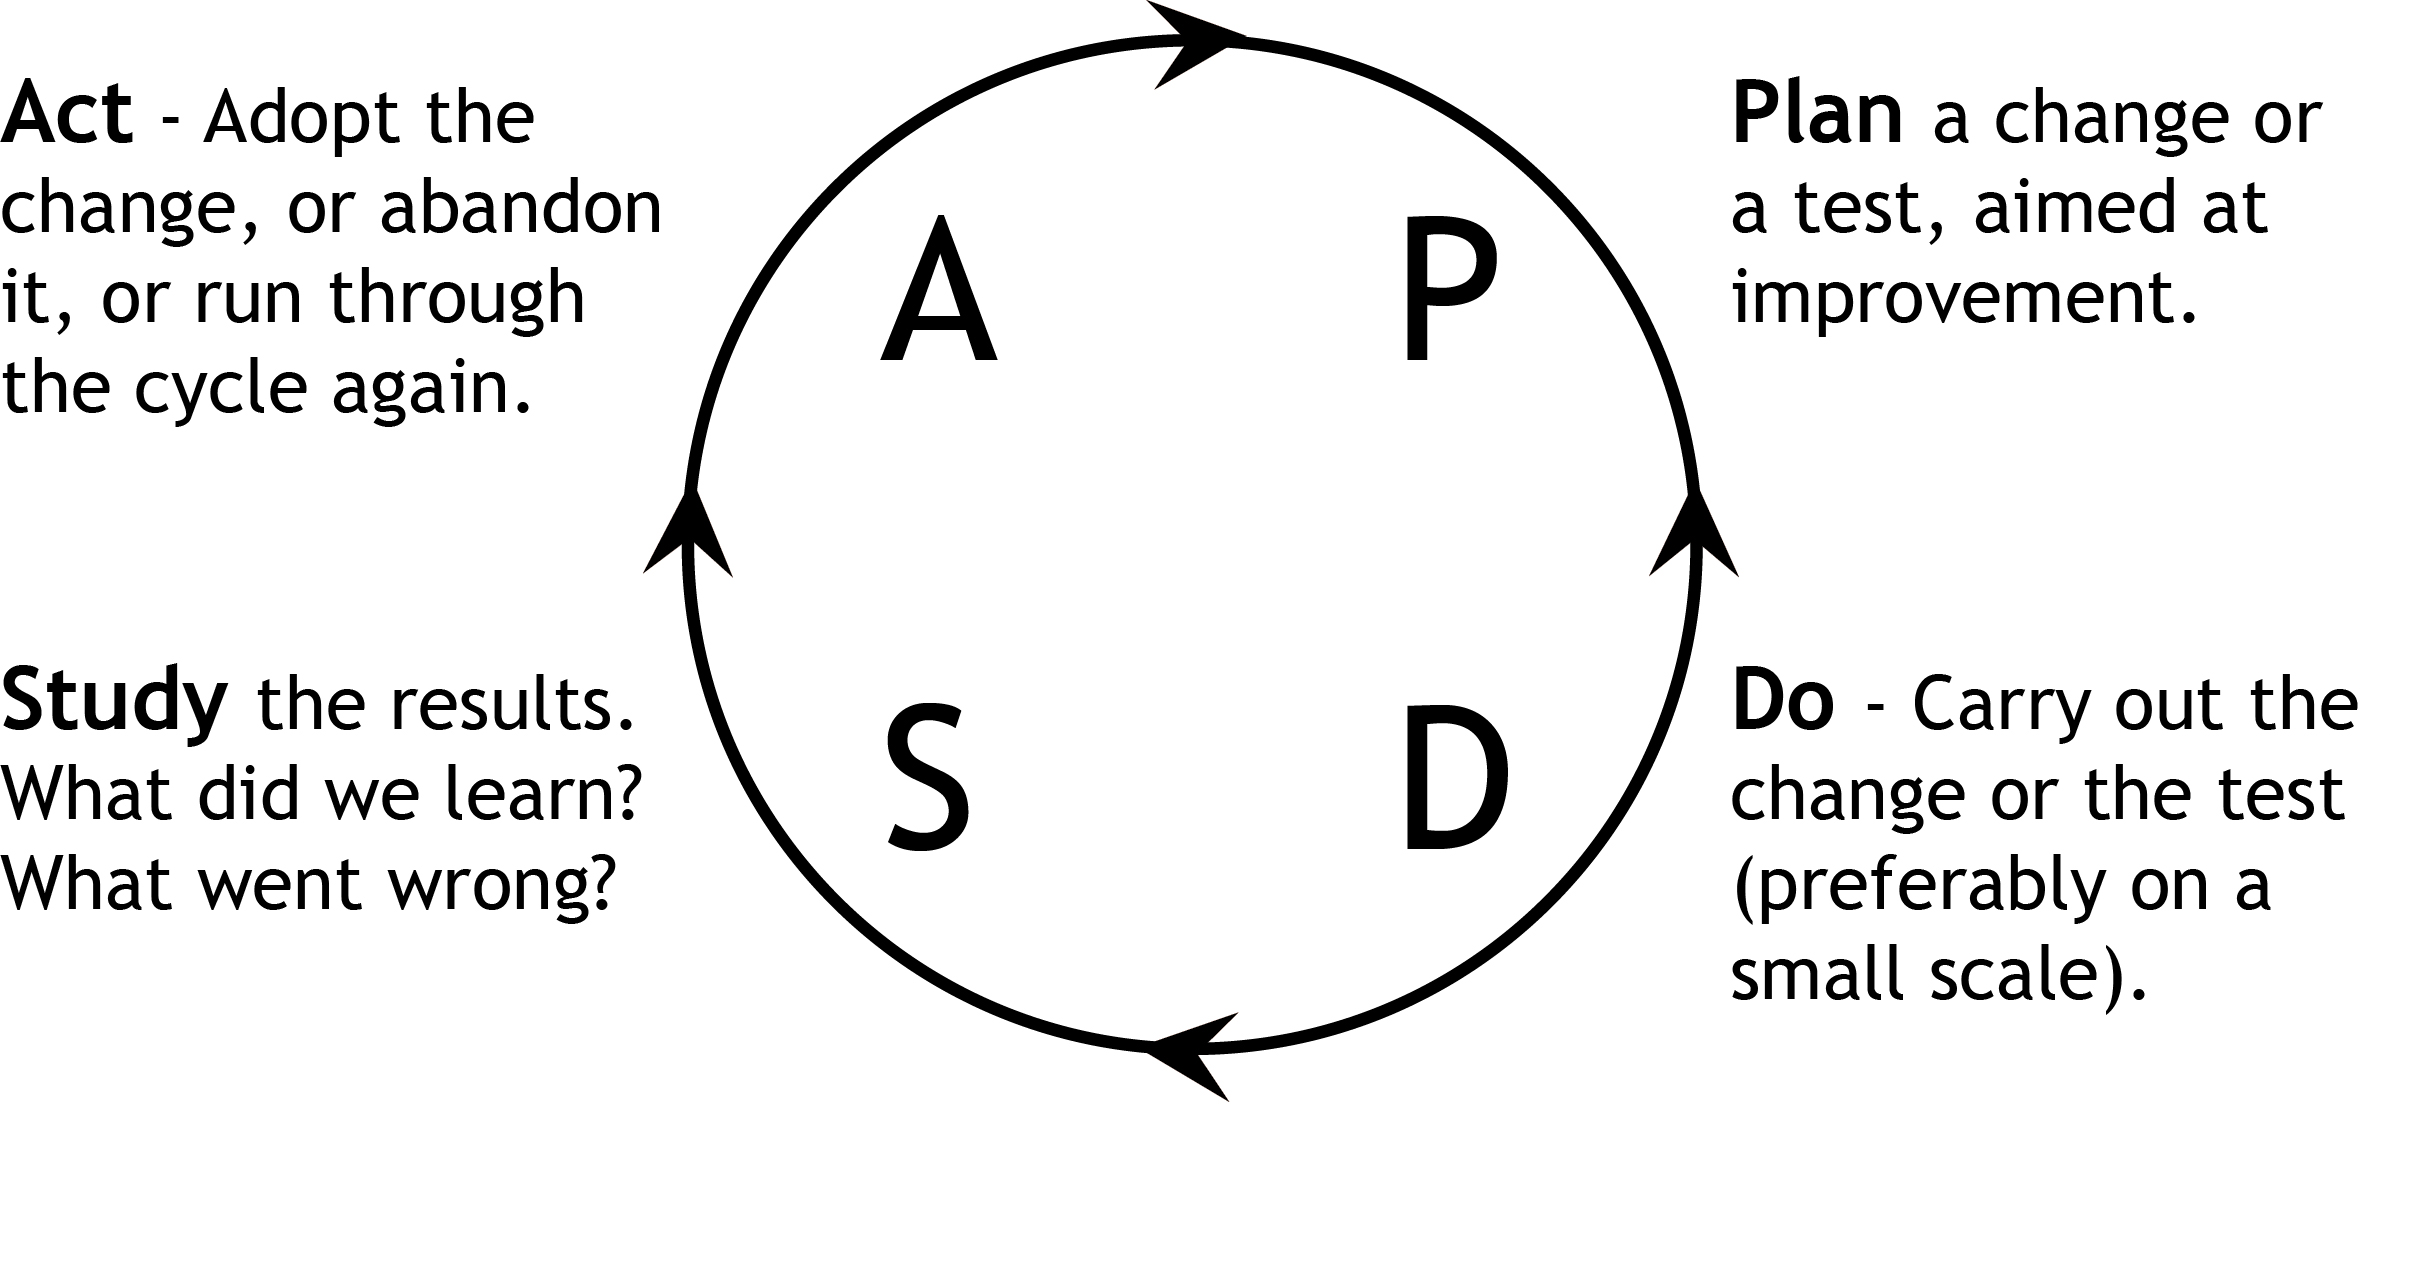
The Quality Learning tools have their origins in quality improvement tools, first introduced in Japan in the 1960s. These early tools, such as the check sheet, fishbone diagram and Pareto chart, were used to gather and display data with a view to improving the quality of products and services. Management tools, such as the affinity diagram, interrelationship digraph and prioritisation matrix, were developed from the 1970s.
Over the past fifty years, additional tools have been developed in the fields of management, planning, statistical analysis, design, inter-personal collaboration, creativity and thinking.
Quality Learning tools are drawn from all of these areas.
Tools and new thinking
Tools are created to solve problems.
New tools usually emerge after thinking about a problem from a new or different perspective.
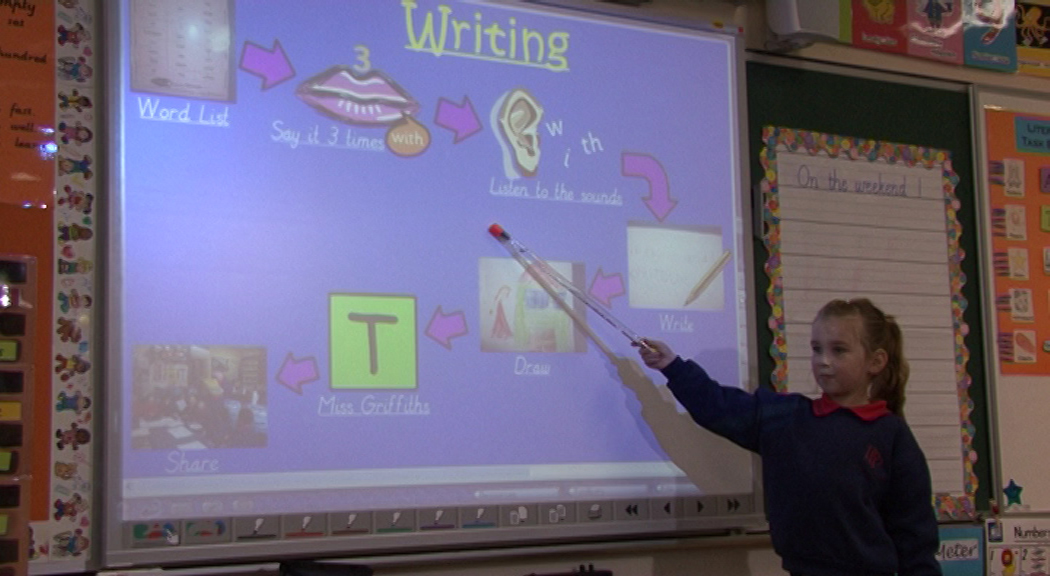
Consider brainstorming, for example. It is a simple tool. Everyone gets to suggest ideas that are recorded for everybody to see. Traditional brainstorming, however, has a number of weaknesses, including potential domination of the group by outspoken individuals and inconsistent levels of participation by group members. These factors frequently impact negatively on the quality of ideas generated.
To address these weaknesses, structured brainstorming was developed. Key differences between structured and traditional brainstorming are:
- All individuals are given time to think about the issue quietly and make a list of ideas they could contribute.
- Ideas are gathered progressively from each member of the group: one idea per person per turn, with the option to ‘pass’ on any turn.
Structured brainstorming was developed to solve the problems of traditional brainstorming.
The thinking that preceded the creation of the new tool or the new technique was inadequate; otherwise the tool would not have been needed. If the old thinking could have solved the problem, there would have been no need to develop a new tool to help understand the problem better or analyse it better. So the creation of the tool is usually a consequence of a shift in thinking.
Jim Duffy, 2015, Knowing & Applying: Breathing new life into service organisations, Deming Learning Network, Aberdeen, Scotland, p66
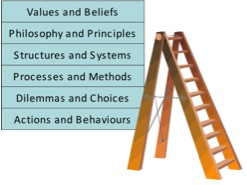
The Quality Learning tools are rooted in the thinking that underpins Quality Learning, namely what Deming called a system of profound knowledge. This philosophy can be summarised as the Principles of Quality Learning.
Tools can encourage everybody to have their say, usually in a structured manner. Everyone comes to understand the perspective of the group as a whole. In this way, they give voice to the silent majority while giving perspective to the vocal minority.
Examples of Quality Learning tools
The following table lists many of the most common Quality Learning tools. They are grouped by the key concepts of Systems, Knowledge, Data and variation, and Psychology and motivation. (Remembering, of course, that these concepts are more strongly interrelated than the following linear list of tools suggests.)
Systems thinking
- Deployment Flowchart
- Fishbone Diagram
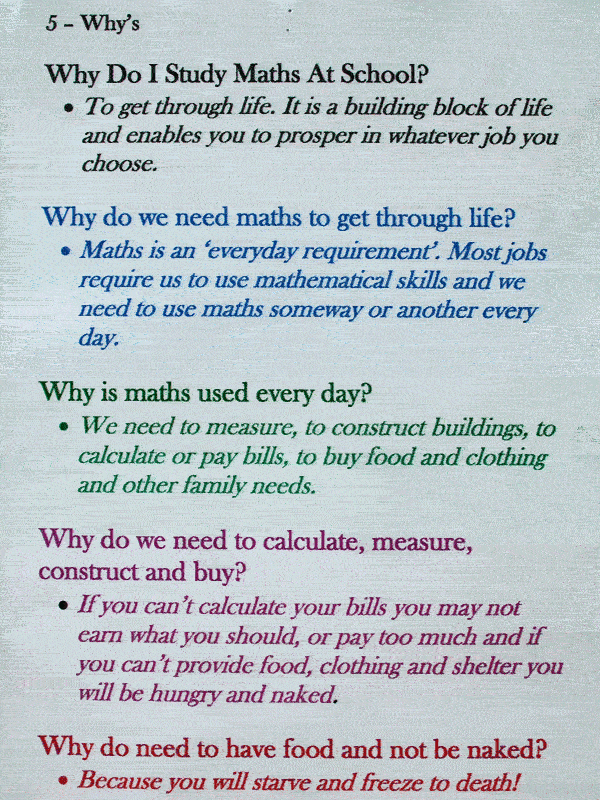
- Five Whys
- Force-field Analysis
- Imagineering
- Interrelationship Digraph
- Paper Passing Purpose Tool (P3T)
- Parking Lot
- Perception Analysis
- Process Accountability Matrix
- Purpose, Outcomes, Process, Evaluation (POPE)
- SIPOC Modelling
- Standard Flowchart
- System Map
- System’s Progress
- Top-down Flowchart
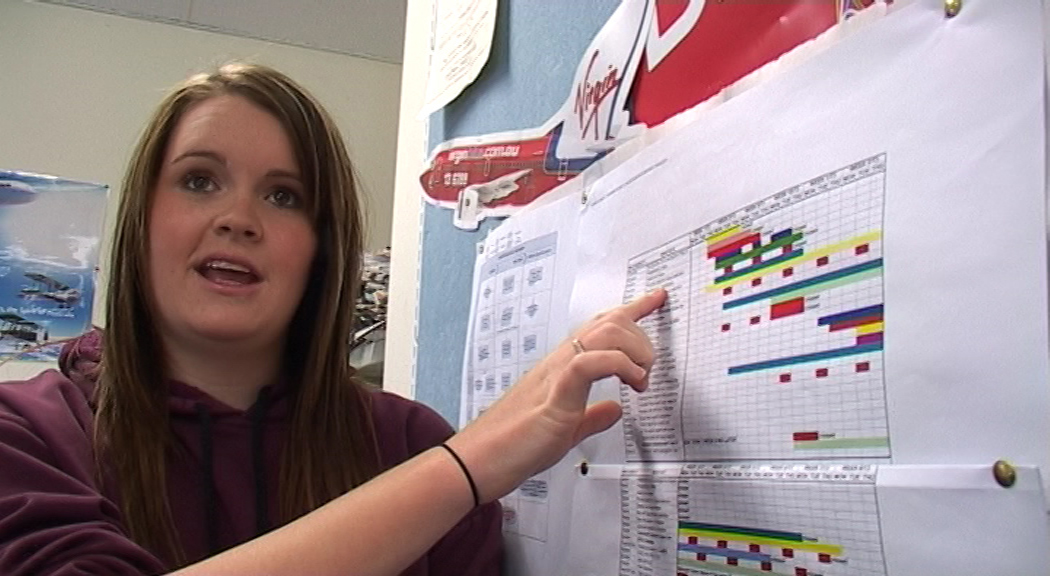
Knowledge and theory
- Bone Diagram
- Gantt Chart
- Hot Dot
- Lotus Diagram
- Operational Definition
- Potential Improvement Matrix
- Problem Statement
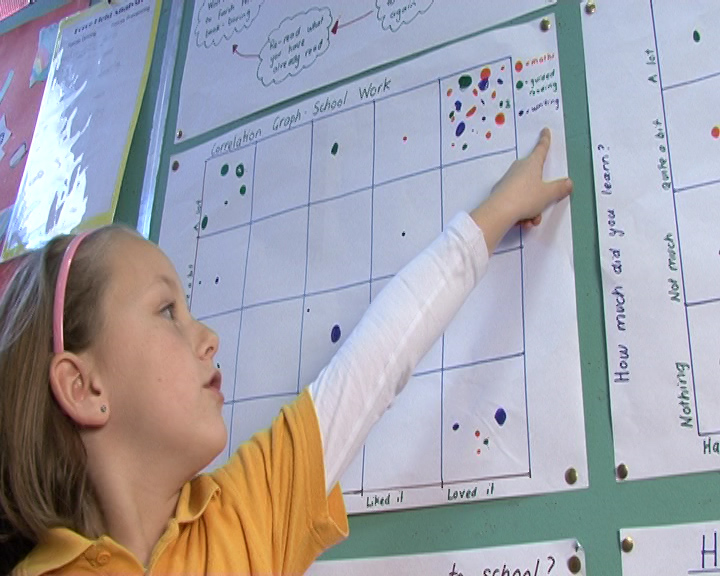
Data and variation
- Affinity Diagram
- Box and Whisker Plots
- Control Chart
- Dot Plot
- Histogram
- Measures Selection Matrix
- Pareto Chart
- Radar Chart
- Run Chart
- Structured Brainstorming
Psychology and motivation
- Action and Agreement Record
- Capacity Matrix
- Code of Cooperation
- Consensogram
- Loss Function
- Plus Delta
There is no definitive list of Quality Learning tools. New ones are being developed daily; old ones are being adapted to new situations. The list above provides a starting point; it may suggest tools you would like to go back to, or new ones you may wish to explore.
Using the tools
As we work with schools and other organisations, one of the most common questions we are asked is: How do I know which tool to use, and when to use it?
The only way to predict whether a tool will be helpful in any given situation is to have tried the tool and learned from its application.
As you use a tool regularly, you come to know the situations in which it is most helpful and those in which it is not.
Learning about the Quality Learning philosophy can also help you apply the tools effectively, as it can deepen your understanding of the thinking behind the tools.
Read more about Quality Learning.
Study the Quality Learning philosophy, as described in our book Improving Learning: A how-to guide for school improvement.
Purchase Tool Time for Education or Tool Time for Business, comprehensive guides to the Quality Learning tools.
Watch a brief video about the use of Capacity Matrices in Primary School or High School.
Watch a brief video about the use of Flowcharts in High School or Primary School.
Watch a brief video about the use of a Gantt Chart in High School.


