Dr W. Edwards Deming was adamant the people have a right to enjoy their work. They have a right to be treated with dignity and respect. Point 8 of his 14 points: Drive out fear.
Whether you are a school leader, classroom teacher, support staff member or student, you have a right to a fear free school. Easier said than done.
Systems and processes can create fear
The systems and processes in many organisation increase fear and anxiety. These include:
Blaming and punishing individuals for deficiencies in the system
Leaving people out of decision-making
Criticising people in front of others
Failing to give people access to the information or resources needed to do a job well
Ignoring suggestions or treating them as criticism
Offering critical feedback on performance without a simultaneous, genuine offer of support
Requiring people to undertake tasks that are unlikely to be completed successfully.
Fear has a way of creeping into organisations, even those that seek to expunge it. Vigilance and effort are required.
Our challenge
Our challenge is to create schools and classrooms where people feel safe and secure. This is not to suggest creating an environment free from responsibility or accountability, rather an environment of respect, dignity and professionalism.
You can begin by asking your staff (if you are a school leader) or your students (if you are a teacher) what causes them to feel anxious or fearful in your school / class? Then work with them to remove these barriers to joy in work and learning.
Reflection
What systems and processes in your workplace give rise to fear?
How do these get in the way of your ability to do a good job?
What practices do you participate in that could promote fear in others?
During the first half of the last century, Joseph Juran undertook studies at Western Electric to examine production defects and nonconformities. Who was to blame for these defects and nonconformities?
He analysed the causes over a defined period of time. Each of the causes were categorised as “management-controllable” or “worker-controllable”. Worker-controllable defects and nonconformities resulted directly from the actions of the worker. Had the worker been doing his job properly these defects and nonconformities would have been prevented. Anything outside the control of the worker was categorised as management-controllable. This included factors such as inadequate training, poor machine maintenance, sub-standard materials, and equipment deficiencies. In other words, anything that is outside the control of the worker is caused by other factors within the system (or the containing systems), which is the domain of management, not the worker.
Don’t blame people; improve the system
Juran’s research led to the often quoted 85/15 rule:
Wherever there is a problem, 85% of the time it will be the system and not the fault of an individual.
In order to bring about improvement, this finding requires us to turn our attention to the system, rather than focus upon individuals.
In social systems, such as schools and classrooms, behaviour and performance are dominated by the impact of structural factors rather than the actions of individuals working within the system.
Peter Senge observed that:
When placed in the same system, people, however different, tend to produce similar results.
Peter Senge, 1990, The Fifth Discipline: The art and practice of the learning organization, Crown, New York, p. 42.
Working on the system
In most schools, the distribution of student performance from one year to the next remains fairly constant. Students in any chosen year level tend to perform similarly to the students that went before them. Teachers’ mark books from year to year look remarkably similar, only the names are different. This is an excellent example of the system producing the results, not the people.
In order to improve performance, we must understand the nature of the systems in which we operate and focus our efforts on working on the system to improve it.
Exhortations, rewards, blame and punishments do nothing to improve the system.They upset people, interfere with relationships and make things worse.
A colleague of ours, Lynne Macdonald, observed:
In schools, parents blame teachers for their children not learning; teachers blame parents; students blame teachers; teachers blame students; principals blame teachers. Where does it get us? Nowhere. So we have to eliminate this blame game.
Lynne Macdonald, retired principal, Plenty Parklands Primary School, Victoria, QLA Case Study 3 DVD.
Most organisations’ problems derive from the system, not the people. Our best efforts cannot compensate for a dysfunctional system.
Dr Myron Tribus learned about this problem in the mid 1940s. His insights may give you courage.
Here is a story Myron told me several years ago.
Irving Langmuir (1881-1957) was awarded a Nobel prize in Chemistry in 1932. During his life he created a long string of diverse inventions in the fields of physics and chemistry.
In 1944 Myron became interested in Langmuir’s work on cloud seeding – precipitating changes in structures within clouds, with the possibility of making rain.
When Myron failed in his attempt to attract the interest of the US military in Langmuir’s work, Langmuir told Myron:
The hardest thing in the world to sell is a new good idea. If it is new, people will not understand it. If it is good, they will feel they must act on it. But, if they are to act on it they will have to learn and they will have to change their ways. And they simply don’t want to do that.
Myron went on to explain:
You present people with a new idea, and their first reaction is ‘this will change things and I am comfortable with what exists’.
I have found this to be true. My life has been spent in bringing new ideas in. In fact, I have been accused of being the kind of person who always seeks something that’s different. I won’t agree with that, but certainly when somebody comes to me with a new idea and I can sense the importance of it then I get behind it. Apparently, that’s a minority view.
Joseph Juran, a highly influential American quality specialist, defined the term “breakthrough” (which was very popular in the late 1980s and early 1990s) as “an improvement to unprecedented levels of performance”. He pointed out:
All breakthrough is achieved project by project, and in no other way.
Joseph Juran, 1988, Juran’s Quality Control Handbook, fourth edition, McGraw-Hill, New York, p. 22.
To achieve significant improvements in capability and performance, in line with the priorities in a school plan, improvement projects are needed.
Improvement plans need to be broken down into finite, definable projects that can be managed over the life of a plan.
A project is a temporary endeavour undertaken to meet specific goals and objectives with a defined beginning and end.
Projects and processes
Projects contrast strongly with daily routines. Daily routines involve the ongoing enactment of an organisation’s processes.
Projects are temporary endeavours to improve an organisation’s processes, to create new products, services or processes, or to build infrastructure.
In short, working in the system is accomplished by process; working on the system is accomplished by project.
Project teams, not committees
This presents a challenge for schools, which are accustomed to establishing committees rather than project teams.
Committees are a common feature of schools. They usually carry responsibilities associated with management and improvement in specific areas of school endeavour but are problematic in that they have an ongoing role and can easily be distracted from improvement efforts.
Project teams are formed for specific, defined timeframes and purposes. Guided by a precise purpose and structured processes, such as the Plan-Do-Study-Act cycle, project teams usually realise greater success. They stay focused and can maintain the energy necessary to see through the improvement, due to a tight, defined timeframe and an effective progress reporting approach.
Our study of schools, in Australia at least, reveals that schools in general, have neither well-developed project management methodologies, nor the management structures and disciplines to execute their improvement plans in this manner. This is a significant capability gap. Until these structures and disciplines are more strongly established, school improvement efforts are likely to continue providing disappointing results.This is not a criticism of schools or those that work within them, rather it is an observation of a systemic failure, which needs to be addressed by senior administrators and policy makers.
An Improvement Project Brief can be used to agree and document the arrangements for each project team.
Collectively, the annual set of improvement projects can be documented and monitored through the annual improvement plan.
In this post, we consider how the concepts of accountability, responsibility and authority are being applied in the name of school improvement. We explain why a strong focus on tightening accountability is unlikely to result in improvement in schools (or any other organisations for that matter).
We defined accountability:
Accountability: the collection of outcomes that an individual is charged to produce and for which the individual can be held to account
The drive to hold educators to account for improving performance has become stronger in recent years. Considerable effort has been expended clarifying the accountabilities and responsibilities of school leaders across many jurisdictions.
Sadly, tightening accountabilities is unlikely to lead to improved performance.
Here’s why.
Intent
There is one benefit to be derived from clarifying accountabilities and responsibilities. Doing so makes clear what is agreed to be important and how performance will be measured. This focuses attention, which can be beneficial. This is particularly beneficial when the process of agreeing and accepting accountabilities is open and collaborative. For example, team members can agree to take on specific tasks between meetings; each agrees to be accountable to the team for their actions. This can be affirming and effective.
Where organisations take a more formal approach to assigning accountability, it becomes problematic.
Assumptions
The accountability approach to school improvement is based on many questionable assumptions.
Held to account?
What does it mean to be held to account? It can be a requirement to explain what happened, or didn’t happen. It can also mean criticism, blame and punishment. Whatever the meaning, being judged is implicit in the definition.
Routinely passing judgements upon one another is not a feature of highly trusting or collaborative relationships and can be toxic.
Sufficiently comprehensive?
Establishing the specific outcomes for which one will be held to account does focus attention, but this can be at the expense of other areas requiring attention. The approach assumes that all the important outcomes have been identified and codified into accountabilities. This is rarely achieved. The current attempts to hold educators to account for student performance based on standardised testing, for example, is leading some to focus attention on the content to be tested; this can be at the expense of other areas of learning.
It is very difficult to establish an accountability system to address all stakeholders needs.
Numerical goals and targets.
Frequently, accountabilities are expressed as numerical goals or targets, which, it is assumed, can be measured accurately. We discussed in chapter five of our book Improving Learning that numerical goals and targets can lead to distortions of the data and/or the system. Each year the newspapers report cases of teachers and schools ‘cheating’ on high-stakes tests. Unachievable numerical goals may be at the heart of the clean diesel scandal at VW.
As Dr. Deming said, “Fear invites wrong figures.”
Locus of control.
It is assumed that an individual has sufficient control over the activities and results for which they are accountable to ensure the outcomes are met. This is not always the case. A teacher, for example, can have almost no control over the home life of his or her students, which has a very significant impact on the student’s learning.
It hardly seems reasonable to be held accountable for things outside one’s control.
Stable and capable processes?
The processes in which the individuals work are assumed to be stable and capable. In other words, it is assumed that the processes are predictable and producing desirable results, making achievement of the accountabilities possible. As we highlighted in chapter two of Improving Learning:
Many processes in school education are not capable.
Motivation?
The approach is based in the assumption that individuals require extrinsic motivation. Motivation has been discussed at length in an earlier series of posts.
Extrinsic motivation factors focus attention on obtaining the rewards and avoiding the punishments; not on the intrinsic value of the tasks themselves.
Negotiated?
While there is, in theory, scope for negotiation of accountabilities, in practice many are established historically and imposed – top-down. It is the people doing the daily work of the system that best know what needs improving. In particular, they know the barriers to improvement, which can frequently only be addressed by individuals more senior to them.
Top-down imposition of accountabilities may address management’s priorities, but are likely to neglect root causes of waste, frustration and poor performance.
Interdependence.
Each individual, being held to account for specific outcomes, is based on an assumption of independent relationships within the organisation: each party acts with autonomy towards their own goals.
Relationships in organisations are far more interdependent than autonomous.
Optimisation of the whole.
A system of accountabilities across an organisation may seek to optimise the performance of the organisation as a whole; there is an assumption that optimising each part of the system will optimise the whole. As we discussed in chapter three of Improving Learning the opposite is true.
By optimising the parts, the whole will be sub-optimised.
On balance, it would appear that focussing on systems to tighten accountabilities holds little promise for delivering improvement. Not only is it difficult to develop and sustain accountability systems within organisations, doing so is based on questionable assumptions. Furthermore, to date, it has demonstrated little systemic improvement.
An alternative
If accountability is not a viable route to improved performance, what should be done instead?
The answer is as simple as it is complex:
Equip everybody so they can work with others to improve the systems of learning for which they are responsible.
In this post, we seek to clarify the concepts of accountability, responsibility and authority. These terms have specific meanings; the concepts are frequently confused. Lack of clarity can result in micro-management.
In the next post, we will explore challenges related to making school leaders accountable for school performance.
Accountability
Let’s begin with a definition.
Accountability: the collection of outcomes that an individual is charged to produce and for which the individual can be held to account
Outcome based
Most individuals in organisations are charged with achieving certain outcomes, their accountabilities.
Negotiated
The outcomes for which an individual is held to account are usually determined through a process of negotiation. The head of a government agency negotiates with their respective government Minister. A chief executive negotiates with their Board. A principal negotiates with the district superintendent, or equivalent.
Outcomes are monitored and reported
Once agreed, progress towards the agreed outcomes is monitored and reported. The most senior people in organisations are held to account for the outcomes achieved by their organisation. This does not mean they are expected to achieve these outcomes on their own; they must work with others in the organisation to achieve their accountabilities.
Cannot be delegated
In a corporate context, a chief executive can negotiate with the chief financial officer, for example, the range of outcomes for which the chief financial officer agrees to be held to account. This is likely to include an accountability that the financial accounts are kept in accordance with relevant laws and accounting standards. The chief executive officer is not absolved from her accountability to ensure that the organisation complies with all relevant laws. The most senior executives remain accountable for the organisation’s performance. This is true even when failure to meet agreed outcomes is the result of someone further down the organisation failing to meet their accountabilities.
In a school context, principals are frequently held to account for student learning outcomes. This accountability is negotiated with their line manager and cannot be delegated. The principal must work with teaching staff to achieve this accountability.
In practice, the negotiation of accountabilities is frequently lost to the history of an organisation. The accountabilities associated with particular roles in the organisation were negotiated long ago and are now accepted as part of that job description. Under these circumstances, there is no fresh negotiation with a new incumbent for a position, rather, the accountabilities are accepted with the job.
Can be accepted
Achievement of outcomes, and thus achievement of accountabilities, is contingent upon the quality of the organisation’s systems and process, as was described in detail in chapter three of our book Improving Learning. The senior executive of the organisation is thus accountable for the performance of all the organisation’s key systems and processes. To manage this accountability in a practical manner, she negotiates for others to accept accountability for specific organisational processes. For example, a principal may negotiate with a deputy for the deputy to accept accountability for the student discipline and welfare processes. Similarly, the school leaders negotiate with classroom teachers the outcomes for which the teachers will be held accountable.
Accountability defines who is to be held to account for the achievement of outcomes.
Responsibility
Accountabilities are achieved through meeting responsibilities.
Responsibility: the work activities and outputs an individual is charged to complete.
Process based
The outcomes for which an organisation strives are achieved through enacting processes. Individuals within the organisation complete their work activities, which, in turn, link together as the organisation’s processes. These processes may be documented as deployment flowcharts that make explicit the responsibilities of those charged with enacting the process steps.
Can be delegated
Responsibilities can be delegated. The principal may, for example, ask the deputy principal to run a staff meeting. A teacher may ask an aide to prepare learning materials. The office manager may delegate responsibility for stationery supplies to an assistant.
When a responsibility is delegated, the accountability for the outcome is not.
Distinct from accountability
At senior levels of an organisation, accountabilities and responsibilities may be significantly different. Senior executives remain accountable for many things upon which they take no action on a day-to-day basis. A school principal remains accountable for the safety and wellbeing of all students in the school, yet has little day-to-day responsibility for sickbay, for example.
At more junior levels, the division between accountabilities and responsibilities becomes less distinct. A classroom teacher is typically responsible for the learning and teaching programs of her classes; the teacher is also accountable for the outcomes of those programs.
Responsibility defines who will undertake specific processes and actions.
Documenting Accountability and Responsibility
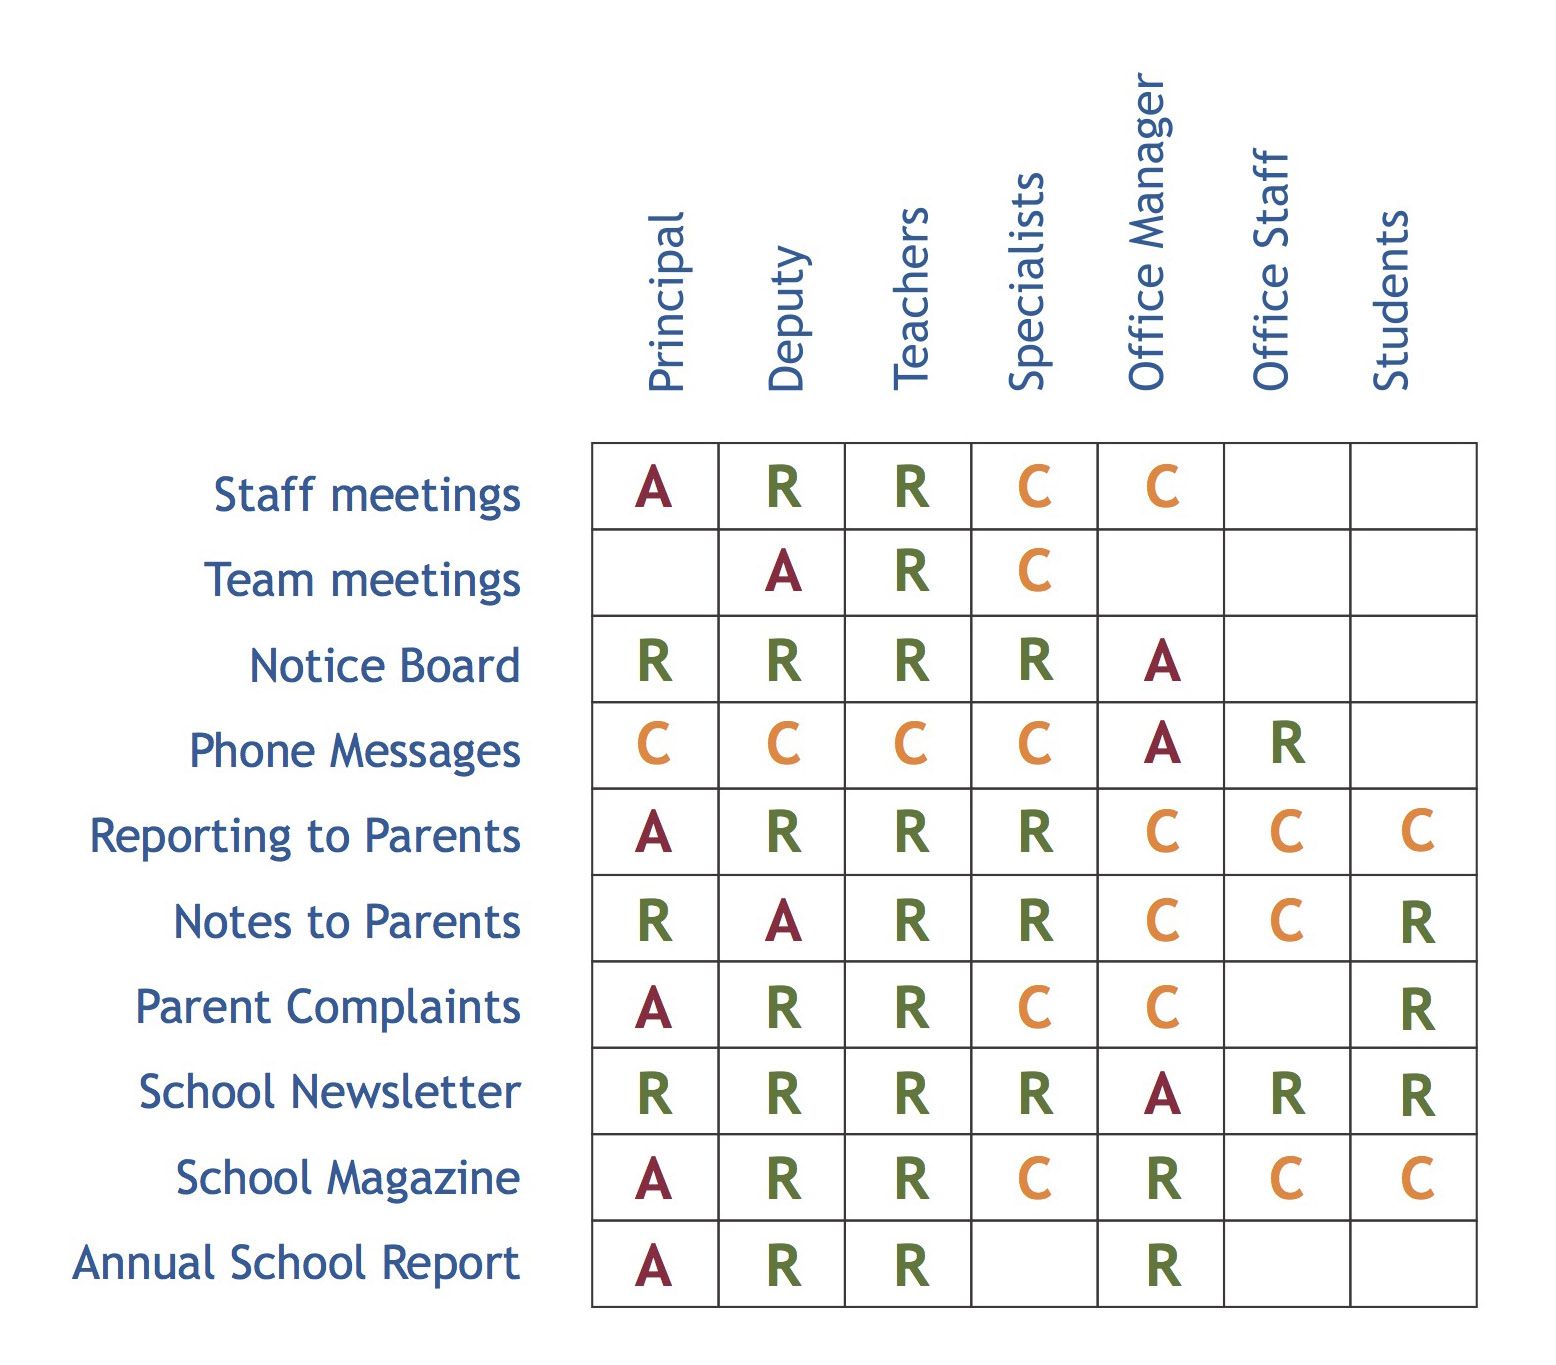
A Process Accountability Matrix may be used to document agreements regarding accountabilities and responsibilities. Key processes are listed in the rows of the matrix and roles identified in the columns. Within each cell of the matrix, the role may be listed as:
Accountable for outcomes of the process.
Responsible for performing actions within the process.
Consulted or informed during execution of the process.
A Process Accountability Matrix can be used to ensure there are no gaps or overlaps in accountability, i.e. each process has one and only one role Accountable for the process. The matrix can also identify roles that have little or too much responsibility and accountability.
Figure 1. Process Accountability Matrix example
Authority
Any discussion of accountability and responsibility is incomplete if it does not also discuss authority.
Authority: the delegated right to make decisions
Decision based
It is important to be clear who is accountable for outcomes and who is responsible for actions. It is equally important to ensure that appropriate authority is delegated; who is authorised to make decisions?
Governments define the structures by which decisions will be made and disputes settled. These delegations are detailed in legislation and regulations. Law enforcement agencies, such as the police, are established to enforce the determinations. Courts are also established to adjudicate disputes.
Delegated
Governments also delegate specific rights to manage and regulate public institutions, including schools. These rights can be delegated to government agencies, and they can also be delegated to non-government agencies such as religious authorities. These agencies and authorities, in turn, delegate specific rights to officials, including school leaders. Through this process of delegation, school leaders have rights to make defined determinations for the school. The specific rights delegated to school leaders vary by jurisdiction. In some cases, school leaders have the right to hire and fire; some have the authority to manage the whole-of-school budget. In other cases, the school principal has significantly less authority.
Authority can be delegated.
Supports responsibility and accountability
Responsibility must be accompanied by authority to make decisions and take action. The school principal can authorise the bursar or business manager to keep financial records and to pay accounts, which is consistent with the bursar’s responsibilities. The office manager may have the responsibility and authority to enrol students. Teachers have the authority and responsibility to report on students’ progress.
Similarly, the negotiation and acceptance of accountability needs to be accompanied by the agreement to delegate the necessary authority to meet those accountabilities. For example, if a deputy principal accepts the accountability of ensuring that school programs comply with the requirements of a national curriculum, they will also need the authority to establish school policies and procedures to ensure this accountability is met.
Avoids micro-mangement
Where authority is not aligned with accountabilities and responsibilities there will be frustration and wasted effort.
Where there is a failure to clearly delegate authority, organisations can become paralysed. If an officer is unsure if they have the authority to make a decision, they will push the decision ‘up the line’. This results in delays and frustration. It also frequently results in more senior leaders’ time being taken up with decisions that could and should have been made at more appropriate levels in the organisation.
Micro-management is a failure to effectively delegate authority.
As is the case with accountabilities and responsibilities, the establishment of delegated authorities is also frequently lost to the history of the organisation, and simply accepted as inherent in the job description.
Authority defines who has the right to make decisions.
See an example of a school Process Accountability Matrix.
The work of every organisation is accomplished through processes.
Processes Defined
Process: a sequence of actions that are enacted to achieve a purpose.
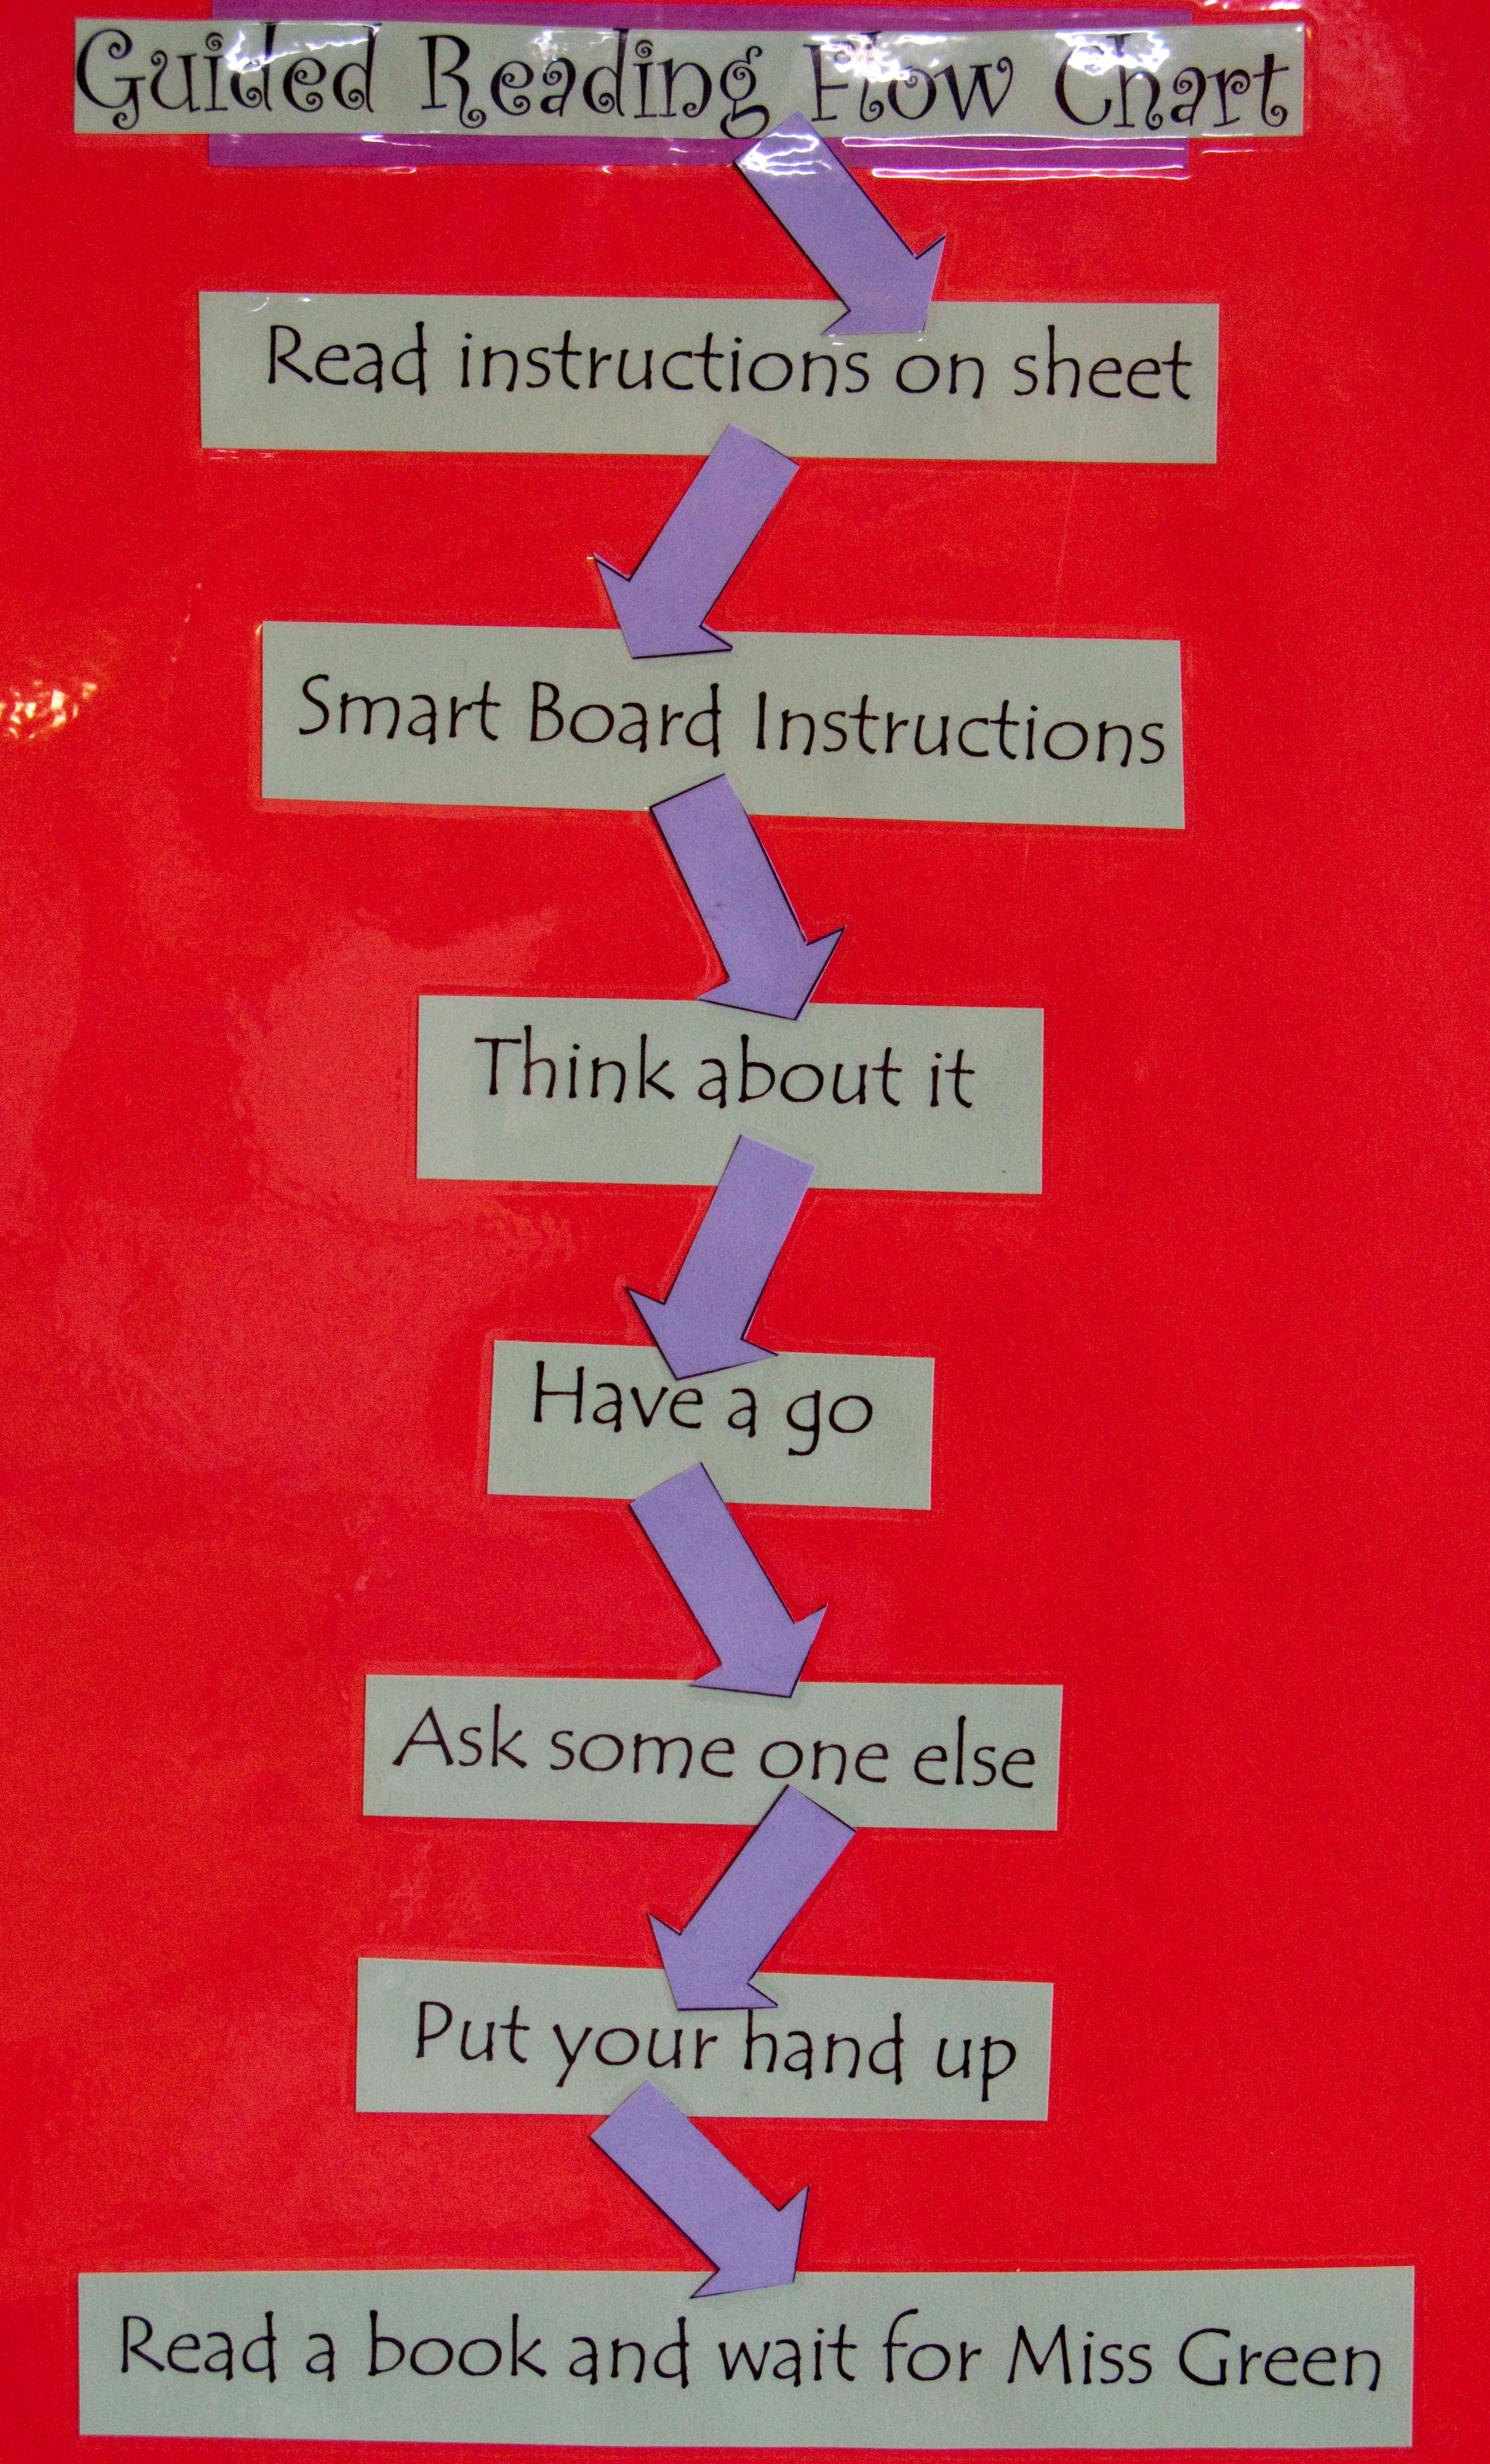
A process consists of actions that are completed in sequence. The sequence of actions comprising a process can be documented, as illustrated in Figure 1.
Figure 1. A Guided Reading Flowchart, from Theodore Primary School
The actions are activities or tasks: things that are done by people, computers and machines.
Getting up in the morning and going to school is a process. It includes actions such as waking up, having breakfast, taking a shower, getting dressed, packing a school bag, and walking to school. These actions are completed in sequence.
A process is, then, a way of doing something: a method.
Key Characteristics of Processes
Purposeful
Processes are means by which the work of an organisation is accomplished. Nothing is achieved without taking action. A sequence of actions is enacted in order to meet some purpose.
Consciously designed… or not
Processes may by consciously designed, defined and documented, or they may be informal and made as needed. Either way, a sequence of actions comprises the process.
Regularly repeated… or not
Most processes in everyday life tend to be repeated on a regular basis.
Processes are usually repeated, in sequence, time after time.
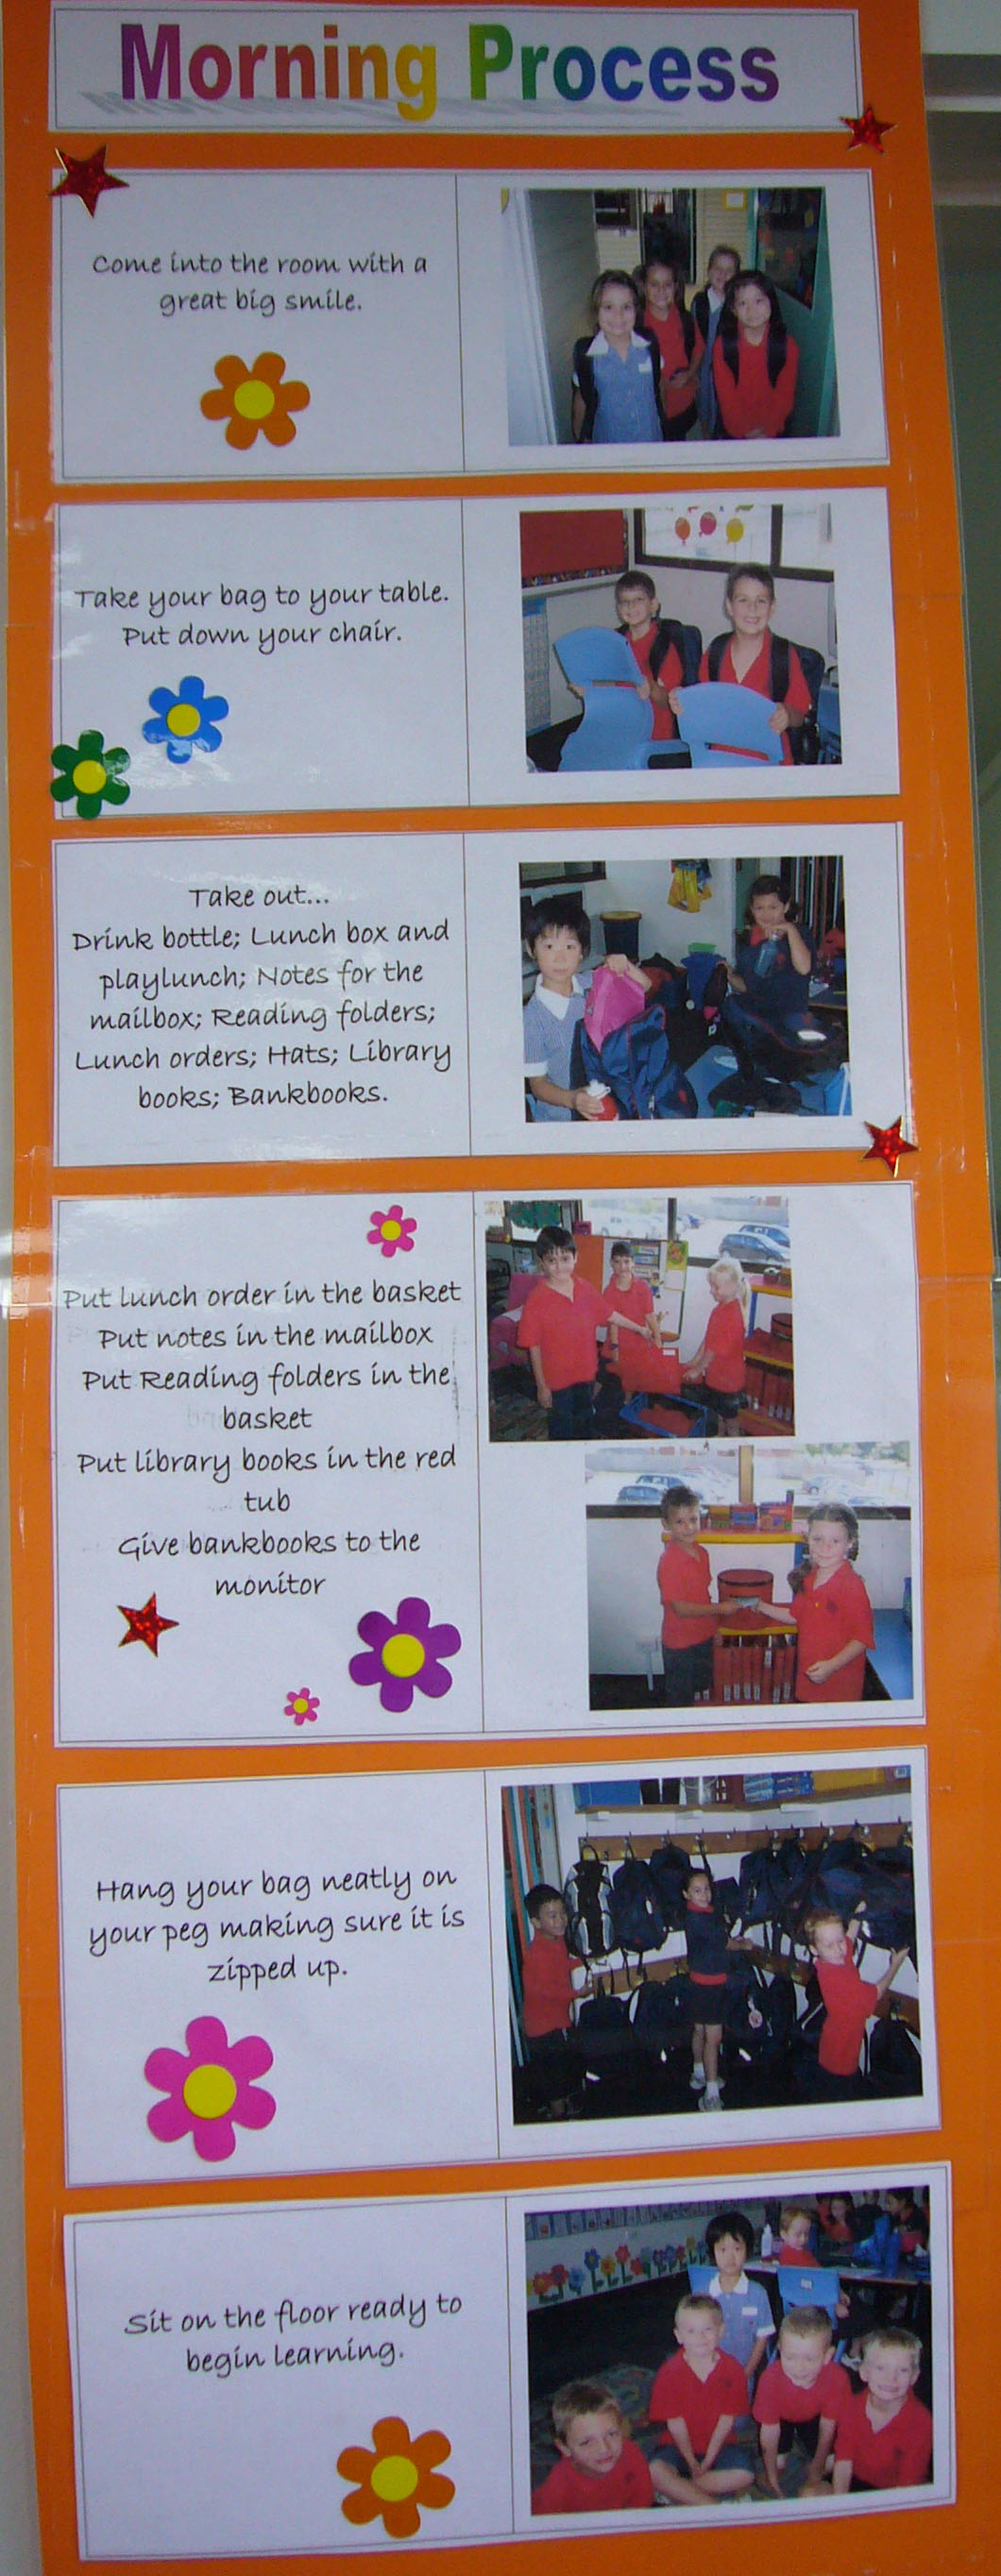
Schools routinely report to parents in a formal manner twice per year, for example. Home learning (homework) process cycles around most days after school. The morning process, such as illustrated in Figure 2, occurs every school day.
Figure 2. A classroom morning process, from Plenty Parklands Primary School.
A few processes may occur only once. A special centenary celebration of a school’s birthday will come around only once. Even so, the preparation, implementation and evaluation of the celebration still comprise a process: it has a sequence of actions that are enacted for a purpose.
Processes are central to improvement
Processes create outputs and deliver outcomes.
If we wish to improve an outcome, we must turn our attention to improving the processes that produced the outcome.
It is important to work on the process that produced the fault, not on him that delivered it.
Edwards Deming, 1994, The New Economics: For industry, government and education, MIT, Massachusetts, p. 39.
This leads to a change of questioning when things don’t go as desired. Instead of asking “whose fault is this?” we can ask “how did our systems and processes allow this to happen?”
If things aren’t going well, fix the process not the blame.
Watch a year two student from Sherbourne Primary School describes the Deployment Flowchart for the spelling process.
There are many types of systems. Social, mechanical, biological, and ecological systems are examples. This post explores the key features of social systems and their implications for leaders of organisations of all types.
Systems
Let’s start with a definition.
A system is a network of interdependent components that work together to try to accomplish the aim of the system.
Edwards Deming, 1994, The New Economics: For industry, government and education, MIT, Massachusetts, p. 5
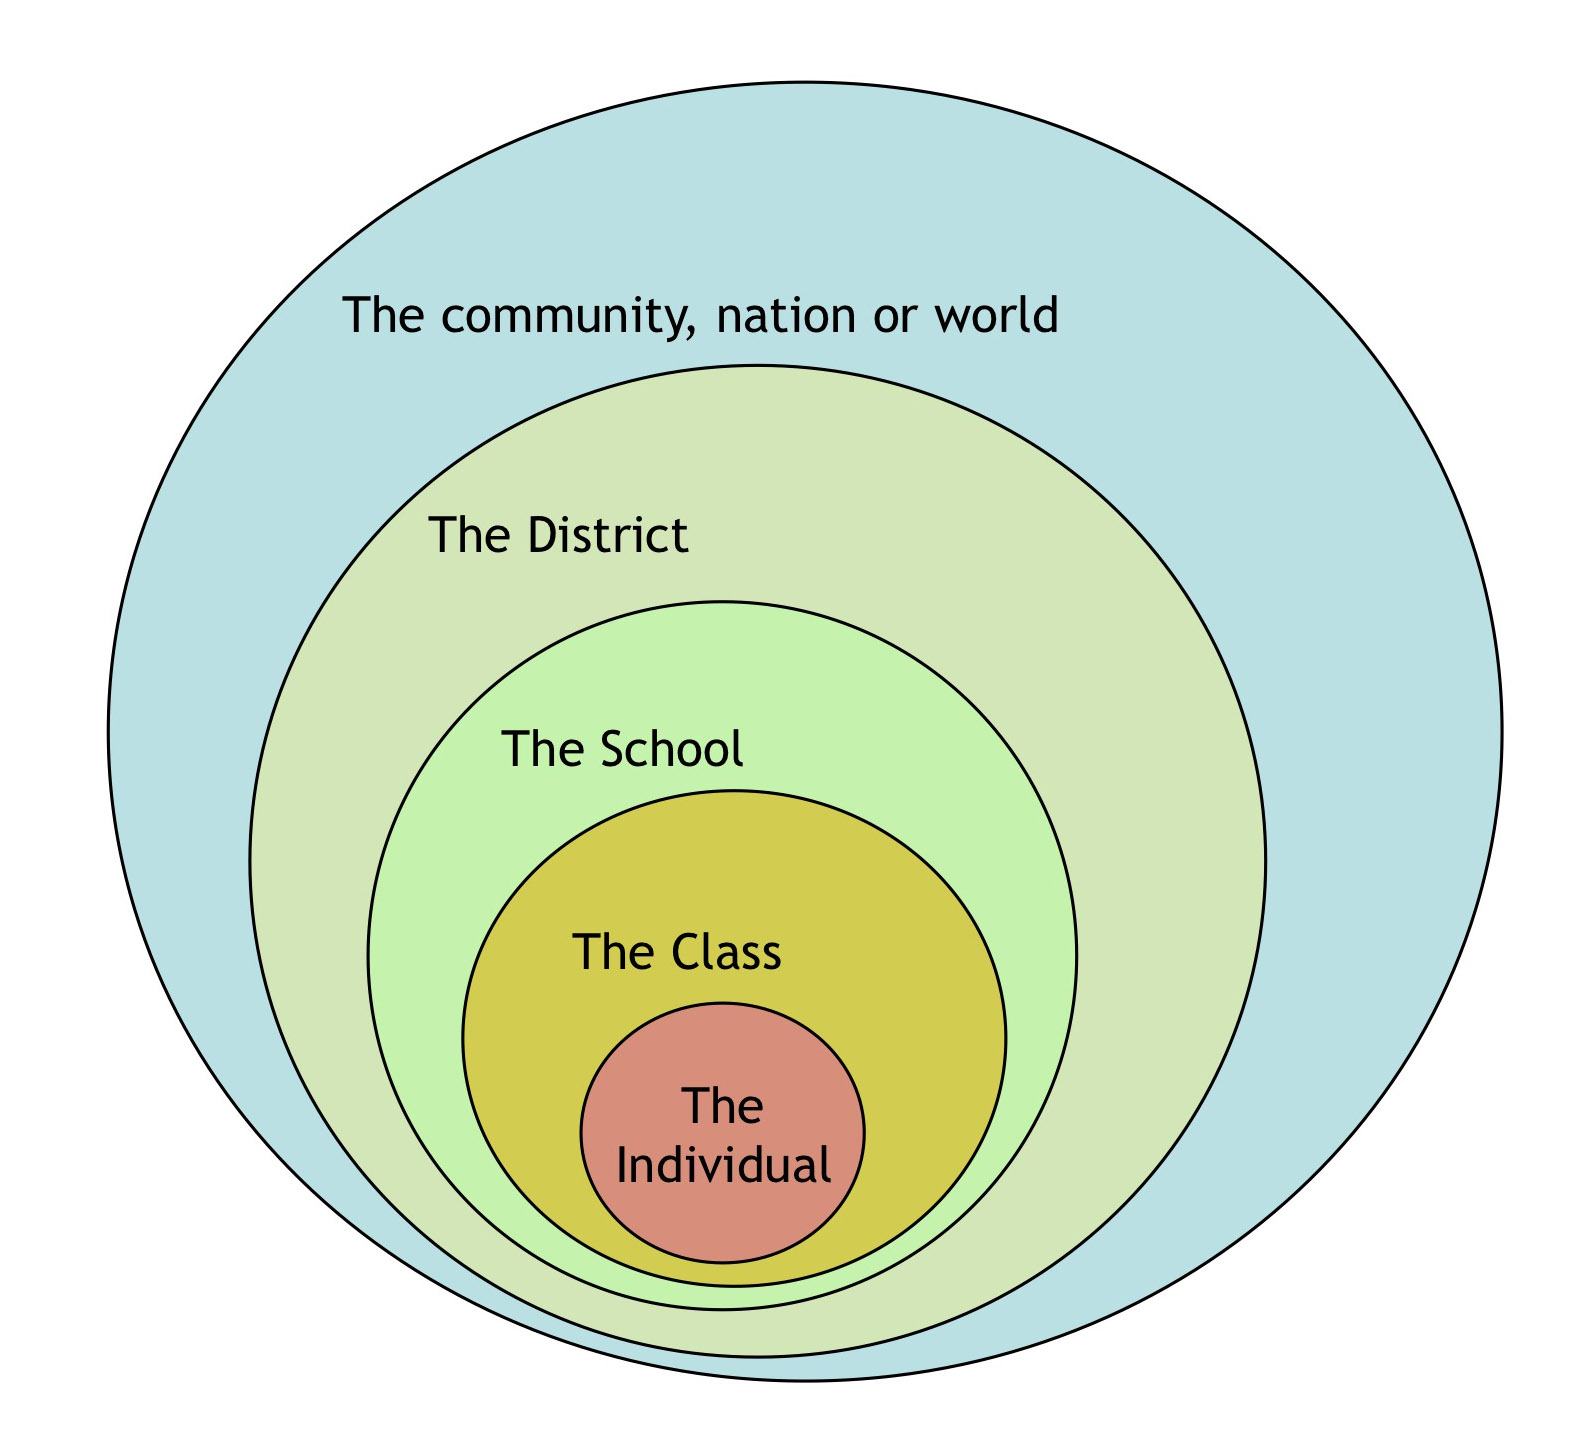
A key feature of systems is interdependence among the elements comprising the system. Another key feature is that systems can nest and be contained within other systems.
To illustrate, the human body is a system of interdependent components. Within the containing system of the human body there are systems such as the nervous, respiratory and circulatory systems. These systems are clearly interdependent.
Figure 1. Systems nest, and are contained, within other systems
Social Systems
Social systems are a specific type of system that exhibit four unique characteristics:
A social system can choose its purpose.
A social system can choose the methods by which it will seek to achieve its purpose.
Elements within a social system can also choose their purpose.
Elements within a social system can choose the methods by which they seek to achieve their purpose.
These characteristics explain why organisations are such dynamic and complex systems to manage and lead.
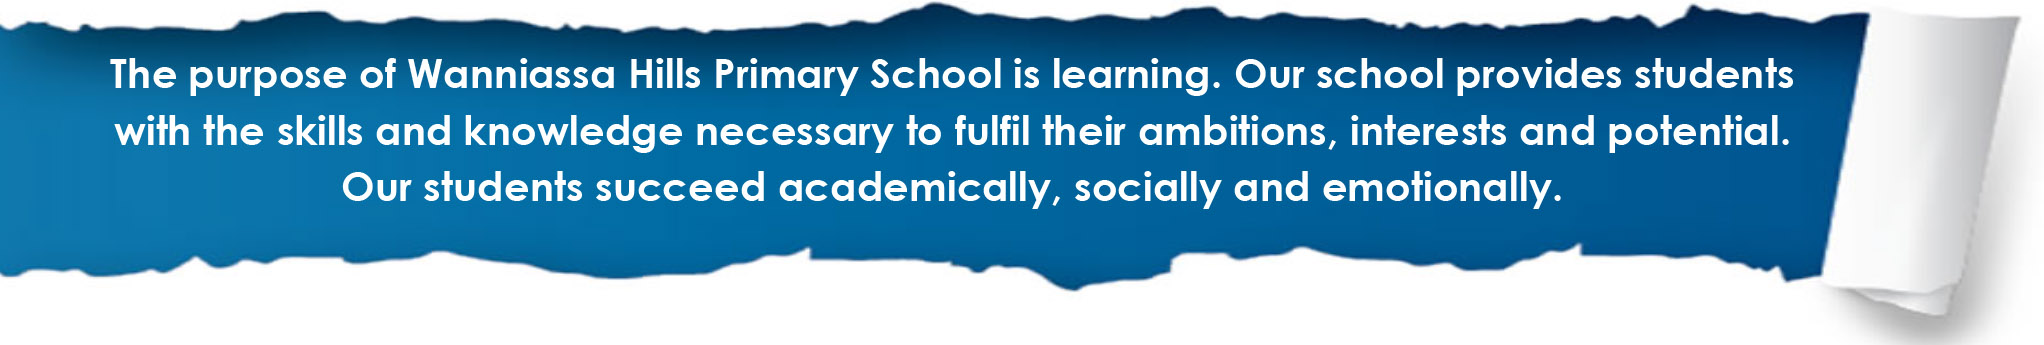
Consider a school, for example. A school is a social system. Within the context of the local education system and its community, a school chooses both its purpose and how it proposes to achieve its purpose. Figure 2 shows the purpose statement for Wanniassa Hills Primary School in the ACT. The school consulted extensively with parents, students and staff over the past few months to discover and document this purpose statement.
Figure 2. Wanniassa Hills Primary School Purpose Statement
Within a school, the various faculties and teams also choose their purposes and methods to achieve them. For the school to optimise its efforts, the aims and methods of the individuals and teams need to align to those of the school as a whole.
Many teachers and school leaders can share stories of individuals and groups within a school not being aligned with the aspirations of the school community as a whole. It can be very frustrating for everyone.
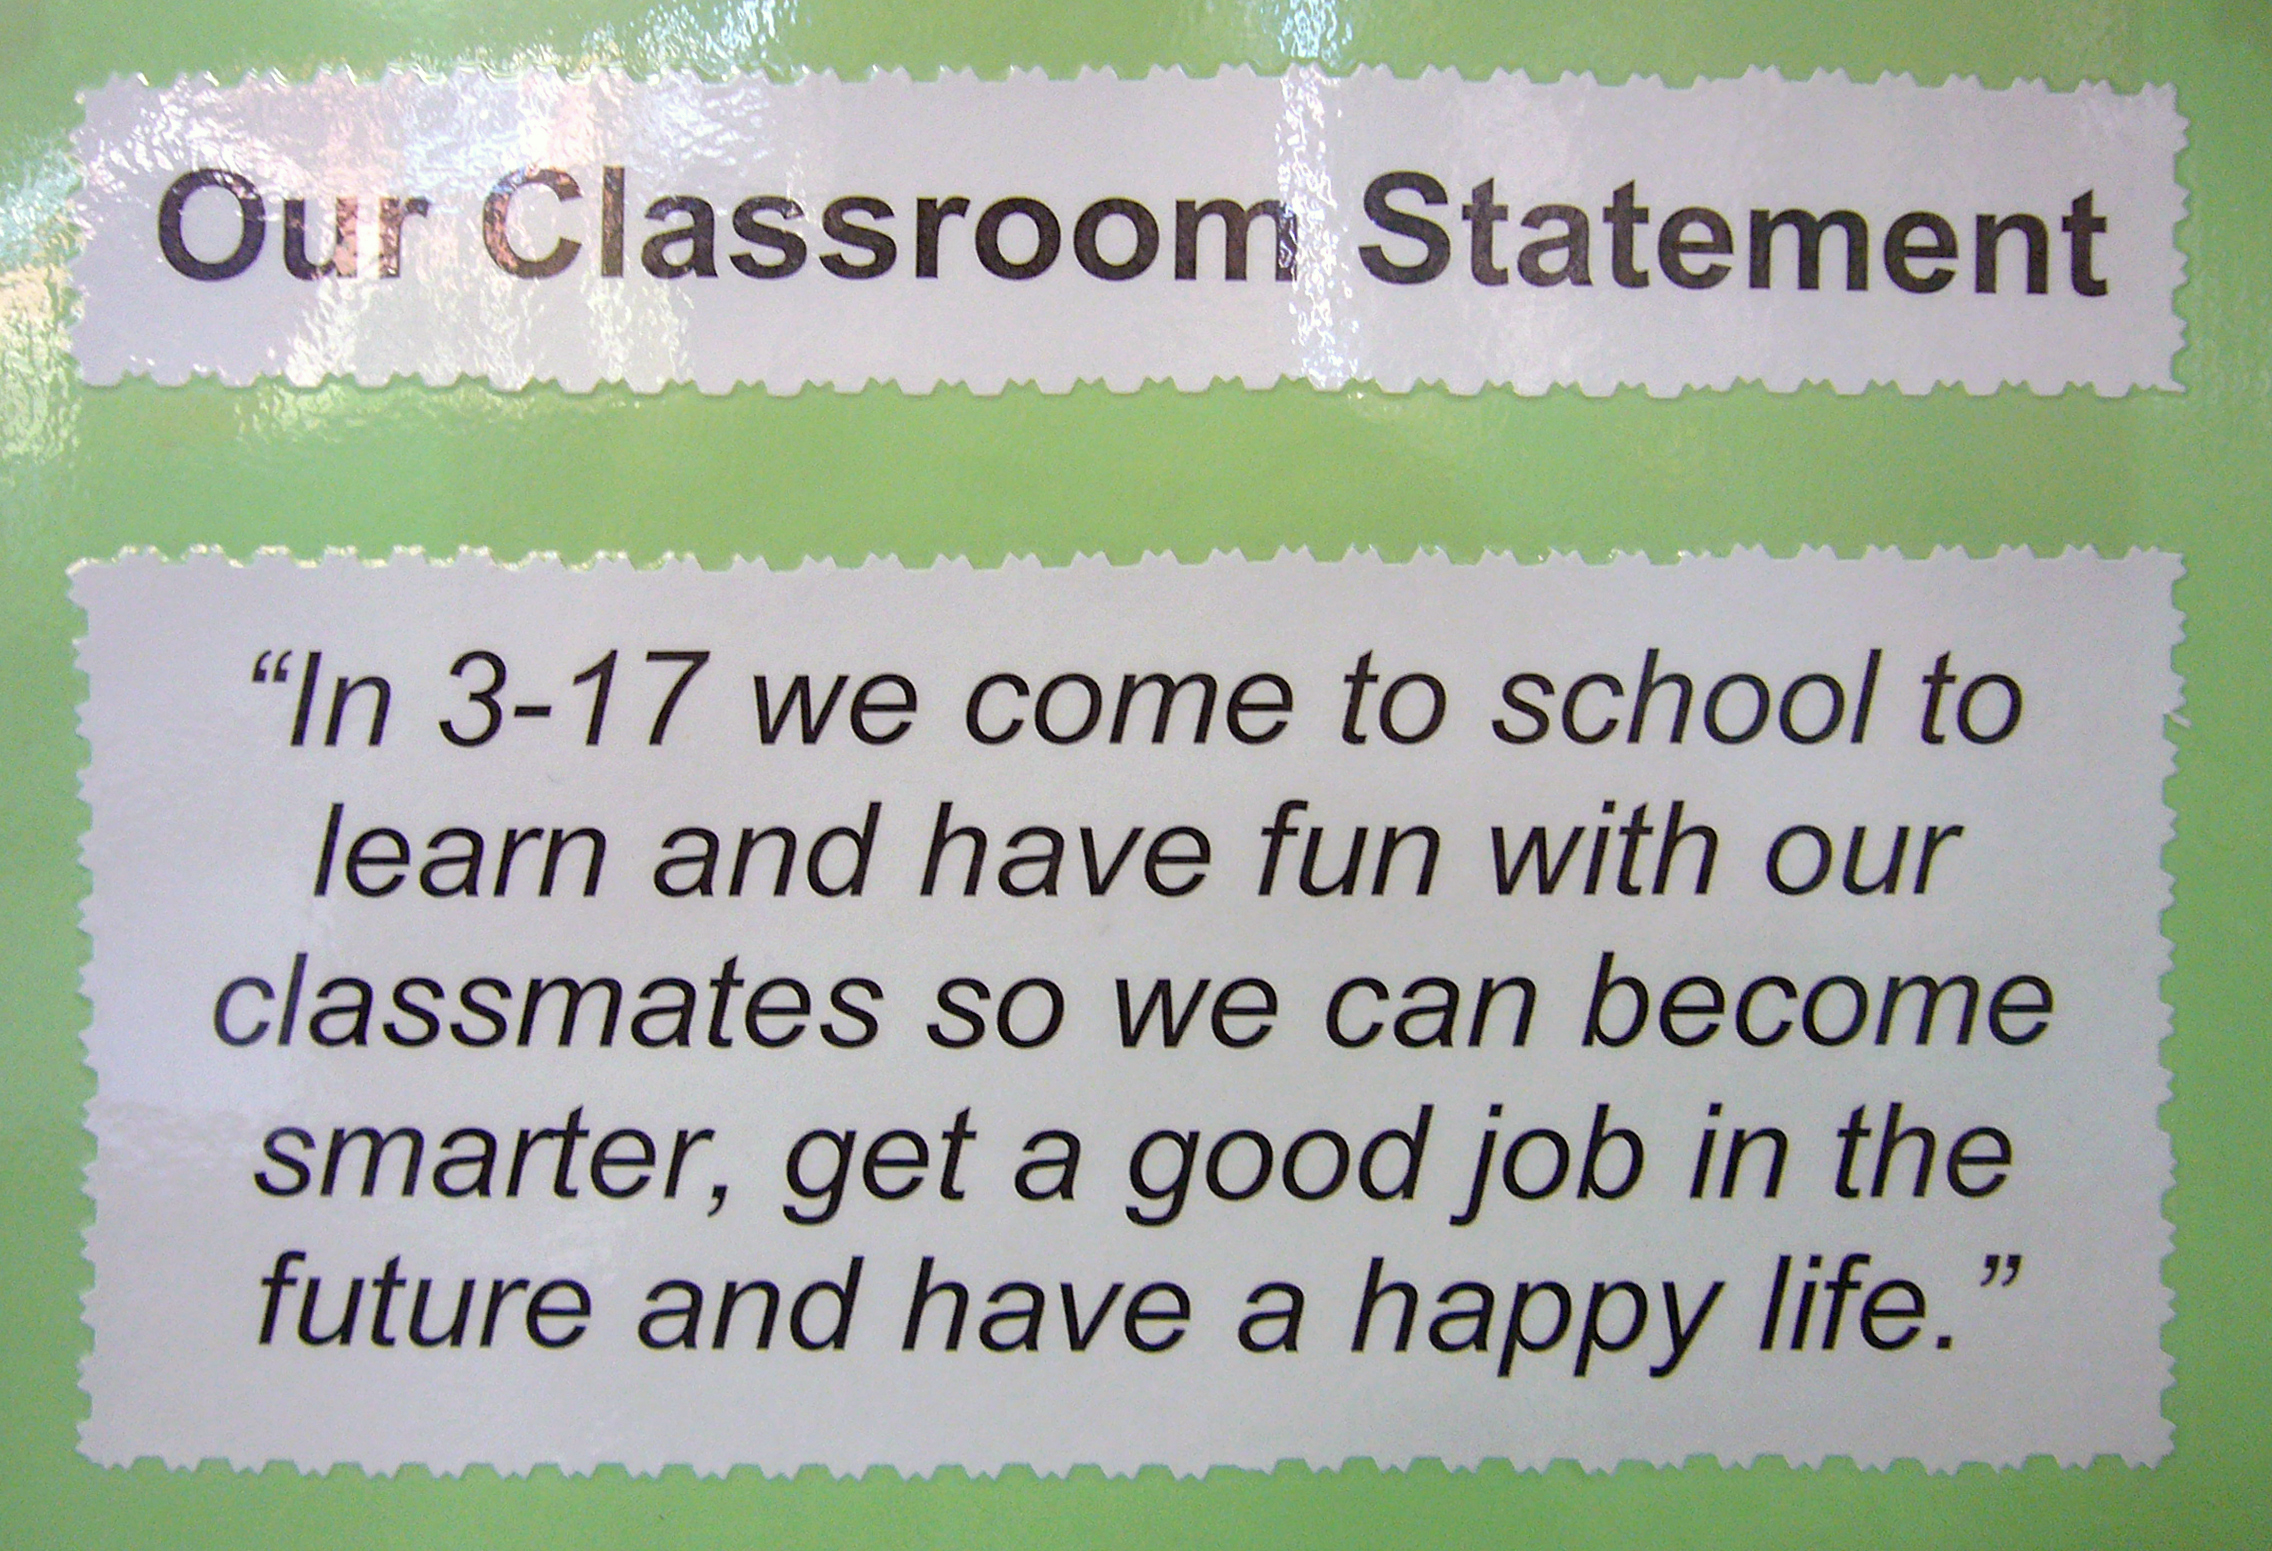
Similarly a class is a social system. The class can choose its purpose, like that shown in Figure 3. The class can also choose how it will seek to fulfil its purpose. Within a class, individual students and groups of students choose their purpose and how they wish to go about it. This is evident from moment to moment as students may choose to ‘tune in’ or engage in disruptive behaviour.
Figure 3. A class clarifies its purpose with a mission statement
In summary:
The system as a whole chooses purpose and methods, as do elements within the system.To optimise the efforts of a school, the purpose and methods of the individuals and groups within the school need to align to that of the school as a whole. The same applies to classrooms.
Interaction effects
A key reason organisations are such dynamic and complex entities is the impact of interactions among the elements. The interactions among members of a class and the interactions among teachers and groups of teachers are two examples of these interaction effects.
As the number of people in an organisation increases, the number of potential interactions increases exponentially. In fact, the impact of interaction effects becomes way more dominant than the impact of individuals within the organisation.
The interactions among individuals and groups can be positive and add to the performance of the whole. They can also be negative and detract from performance.
Interactions can lead to harmony, and they can lead to discord.
This is self evident to most teachers and school leaders who have worked in a variety of schools, from those with a tired and cynical culture to the vibrant and collaborative team.
Interaction may reinforce efforts, or it may nullify efforts.
Edwards Deming, 2012, The Essential Deming: Leadership Principles from the Father of Quality, edited by Joyce Orsini, McGraw-Hill, New York, p. 78.
Interactions dominate the behaviour and performance of social systems. Consequently, the behaviour and performance of a classroom, workgroup or organisation is much more heavily influenced by the interaction among people than by the direct impact of each individual. This is why creating a school climate that promotes caring and productive relationships is so important.
Conclusion
Schools are complex, dynamic and highly relational social systems. The interdependence among the individuals and groups within schools and the interactions among them, are key determinants of the culture, behaviour and performance of the school. The same applies to classrooms.
It is incumbent on leaders, therefore, to ensure that system and processes promote positive interactions with purposeful and harmonious relationships.
Sometimes it’s desirable to gather views on more than one issue, and to examine the relationship between responses to these issues.
A Correlation Chart is useful for examining the relationship between responses.
Correlation Chart
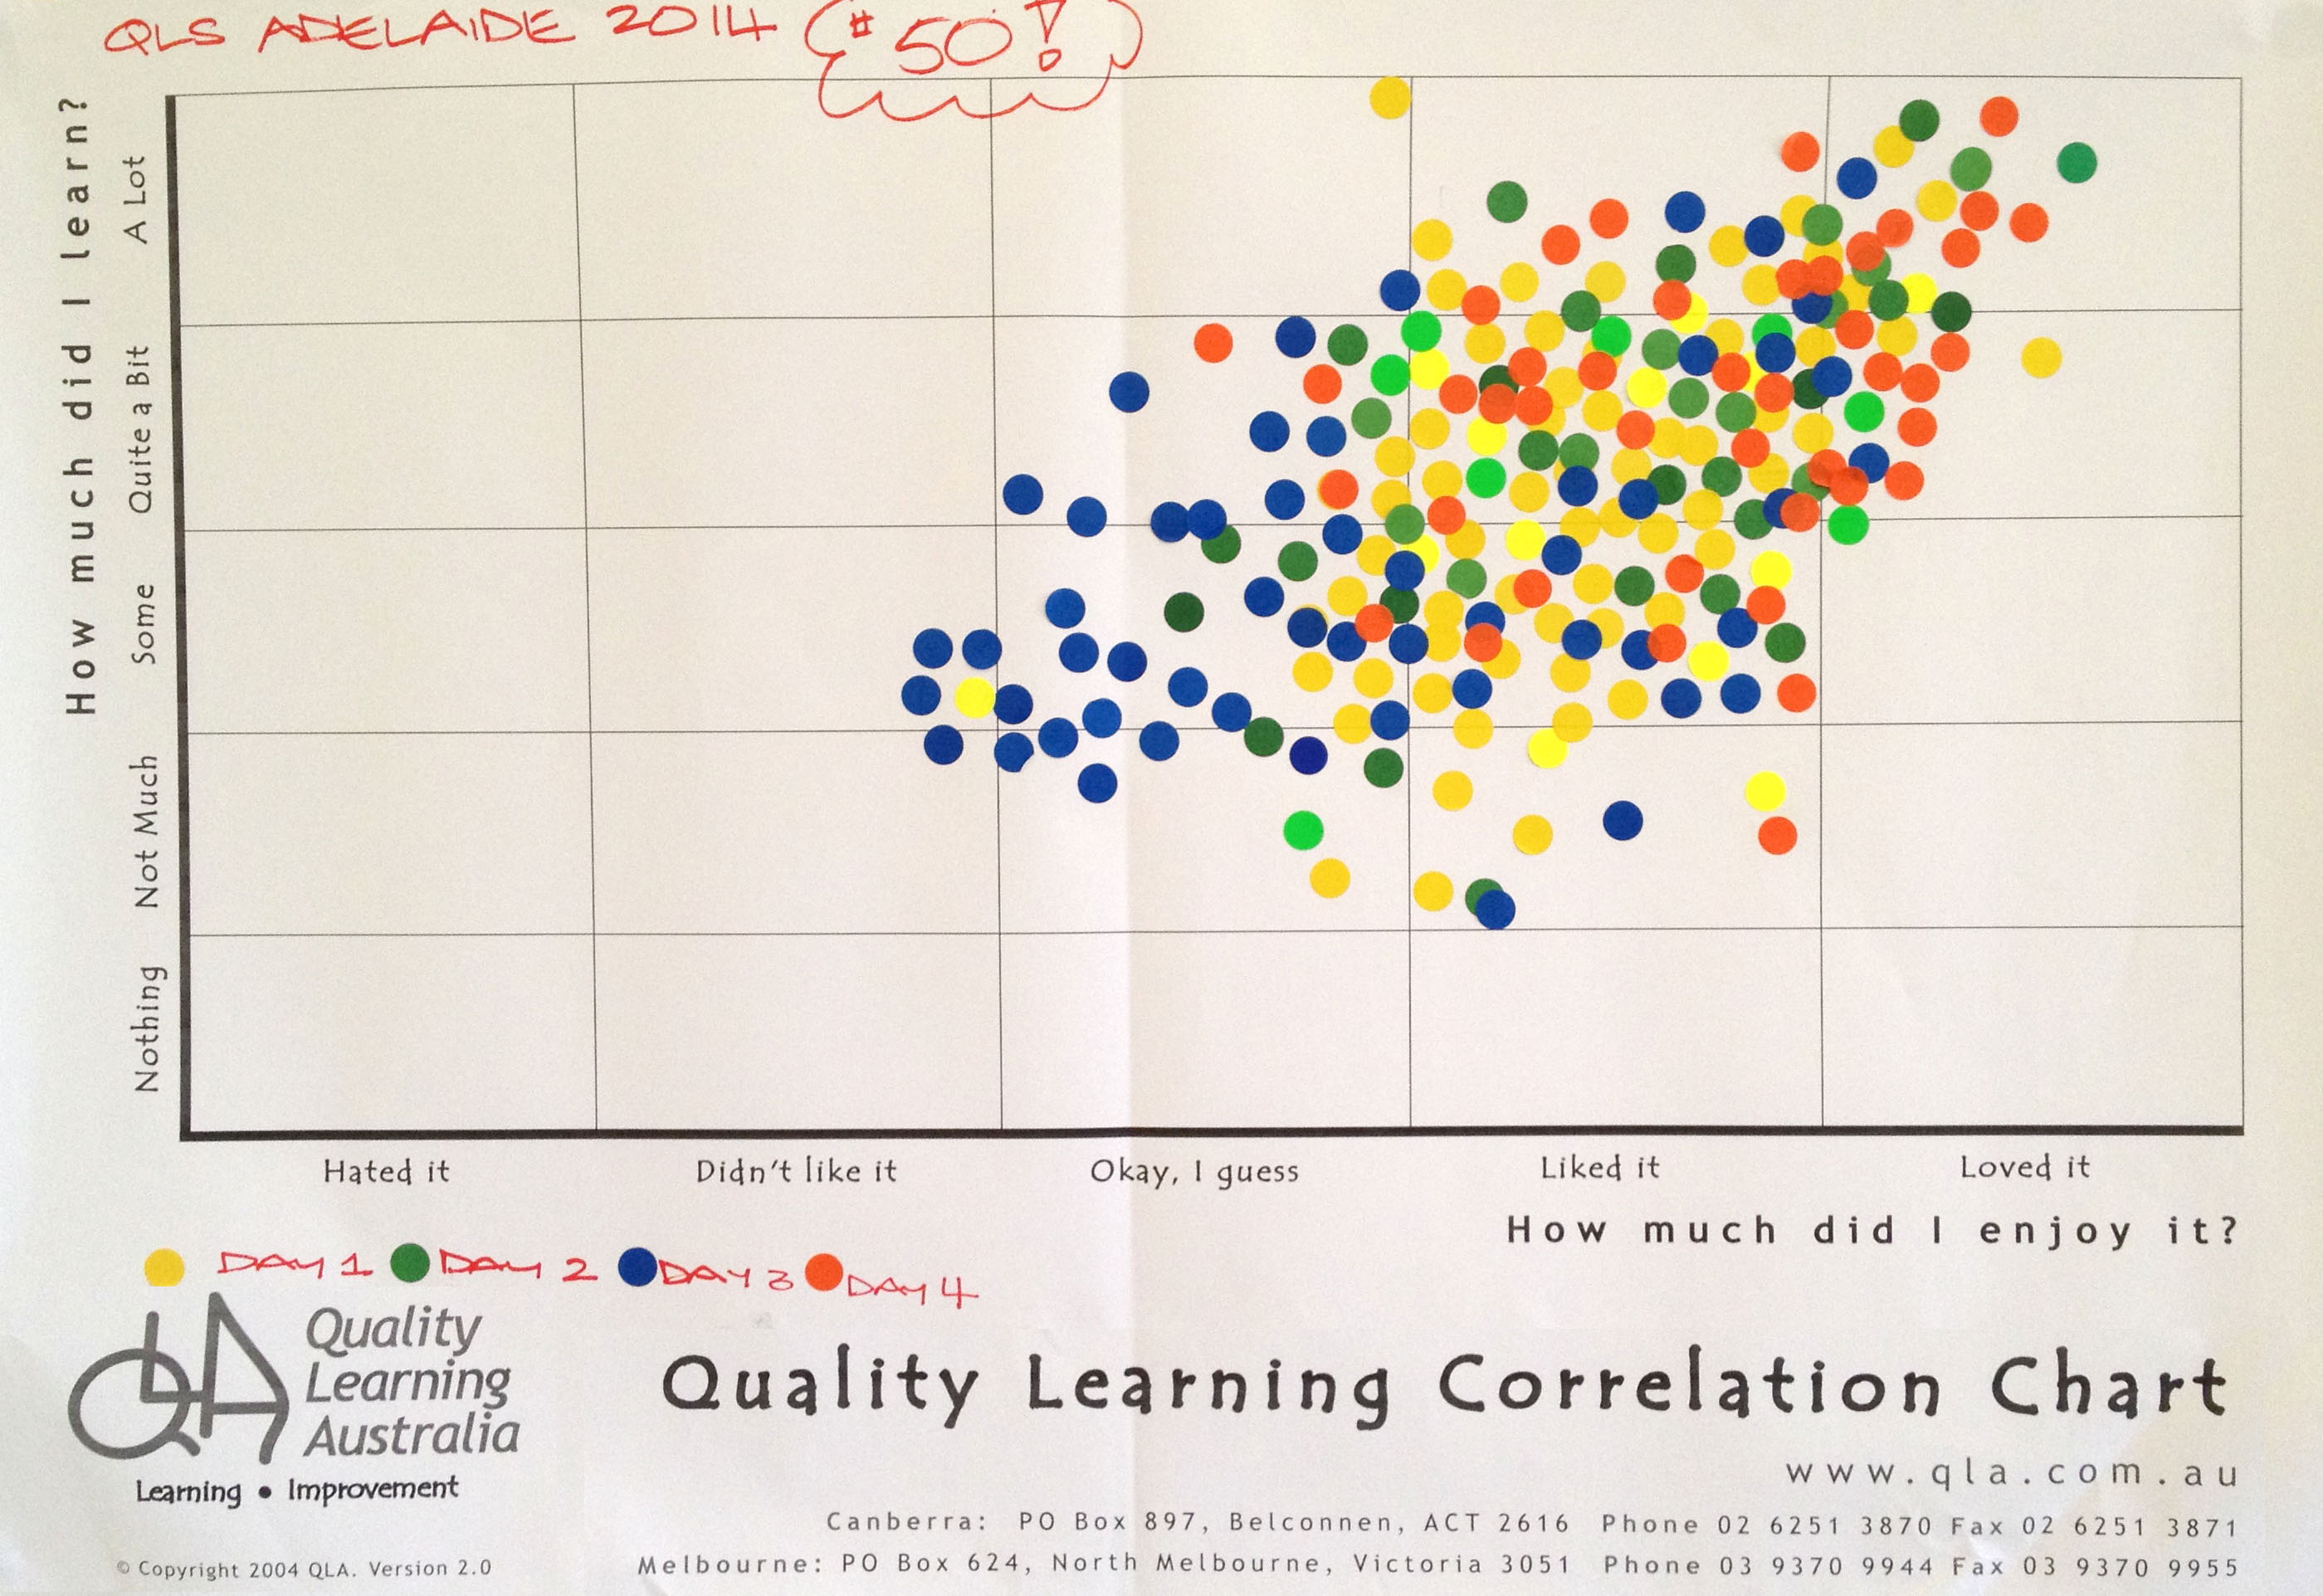
We regularly use a Correlation Chart as a quick and effective way to gather feedback from participants in our workshops. Figure 1 shows a Correlation Chart from a workshop – the 50th four-day Quality Learning Seminar with David Langford held in Australia.
Figure 1. Workshop participant feedback on a Correlation Chart
Many teachers use a Correlation Chart at the end of a unit of work to gather student feedback on the unit.
Set the questions and scale
The first step when using a Correlation Chart is to decide the questions. The most common question are those shown in Figure 1, namely:
How much did you enjoy the workshop/course/unit of work?
How much did you learn?
The questions must lend themselves to a scaled response.
Binary questions, which have only two responses such as yes or no, don’t work for a Correlation Chart.
Scales we have seen used effectively include:
Frequency: rarely to nearly always
Importance: not important to critical
Performance: very poor to excellent
Amount: nothing to a lot
Disposition: hate it to love it
Knowledge: never heard of it to mastered it
Confidence: not confident to supremely confident.
Whichever scale you choose, respondents will find it helpful if you define ‘anchor points’ along the scale. We typically define five such points. For example, for Frequency:
Rarely (10%)
Sometimes (25%)
Moderately (50%)
Mostly (75%)
Nearly Always (90%)
Gather and display the data
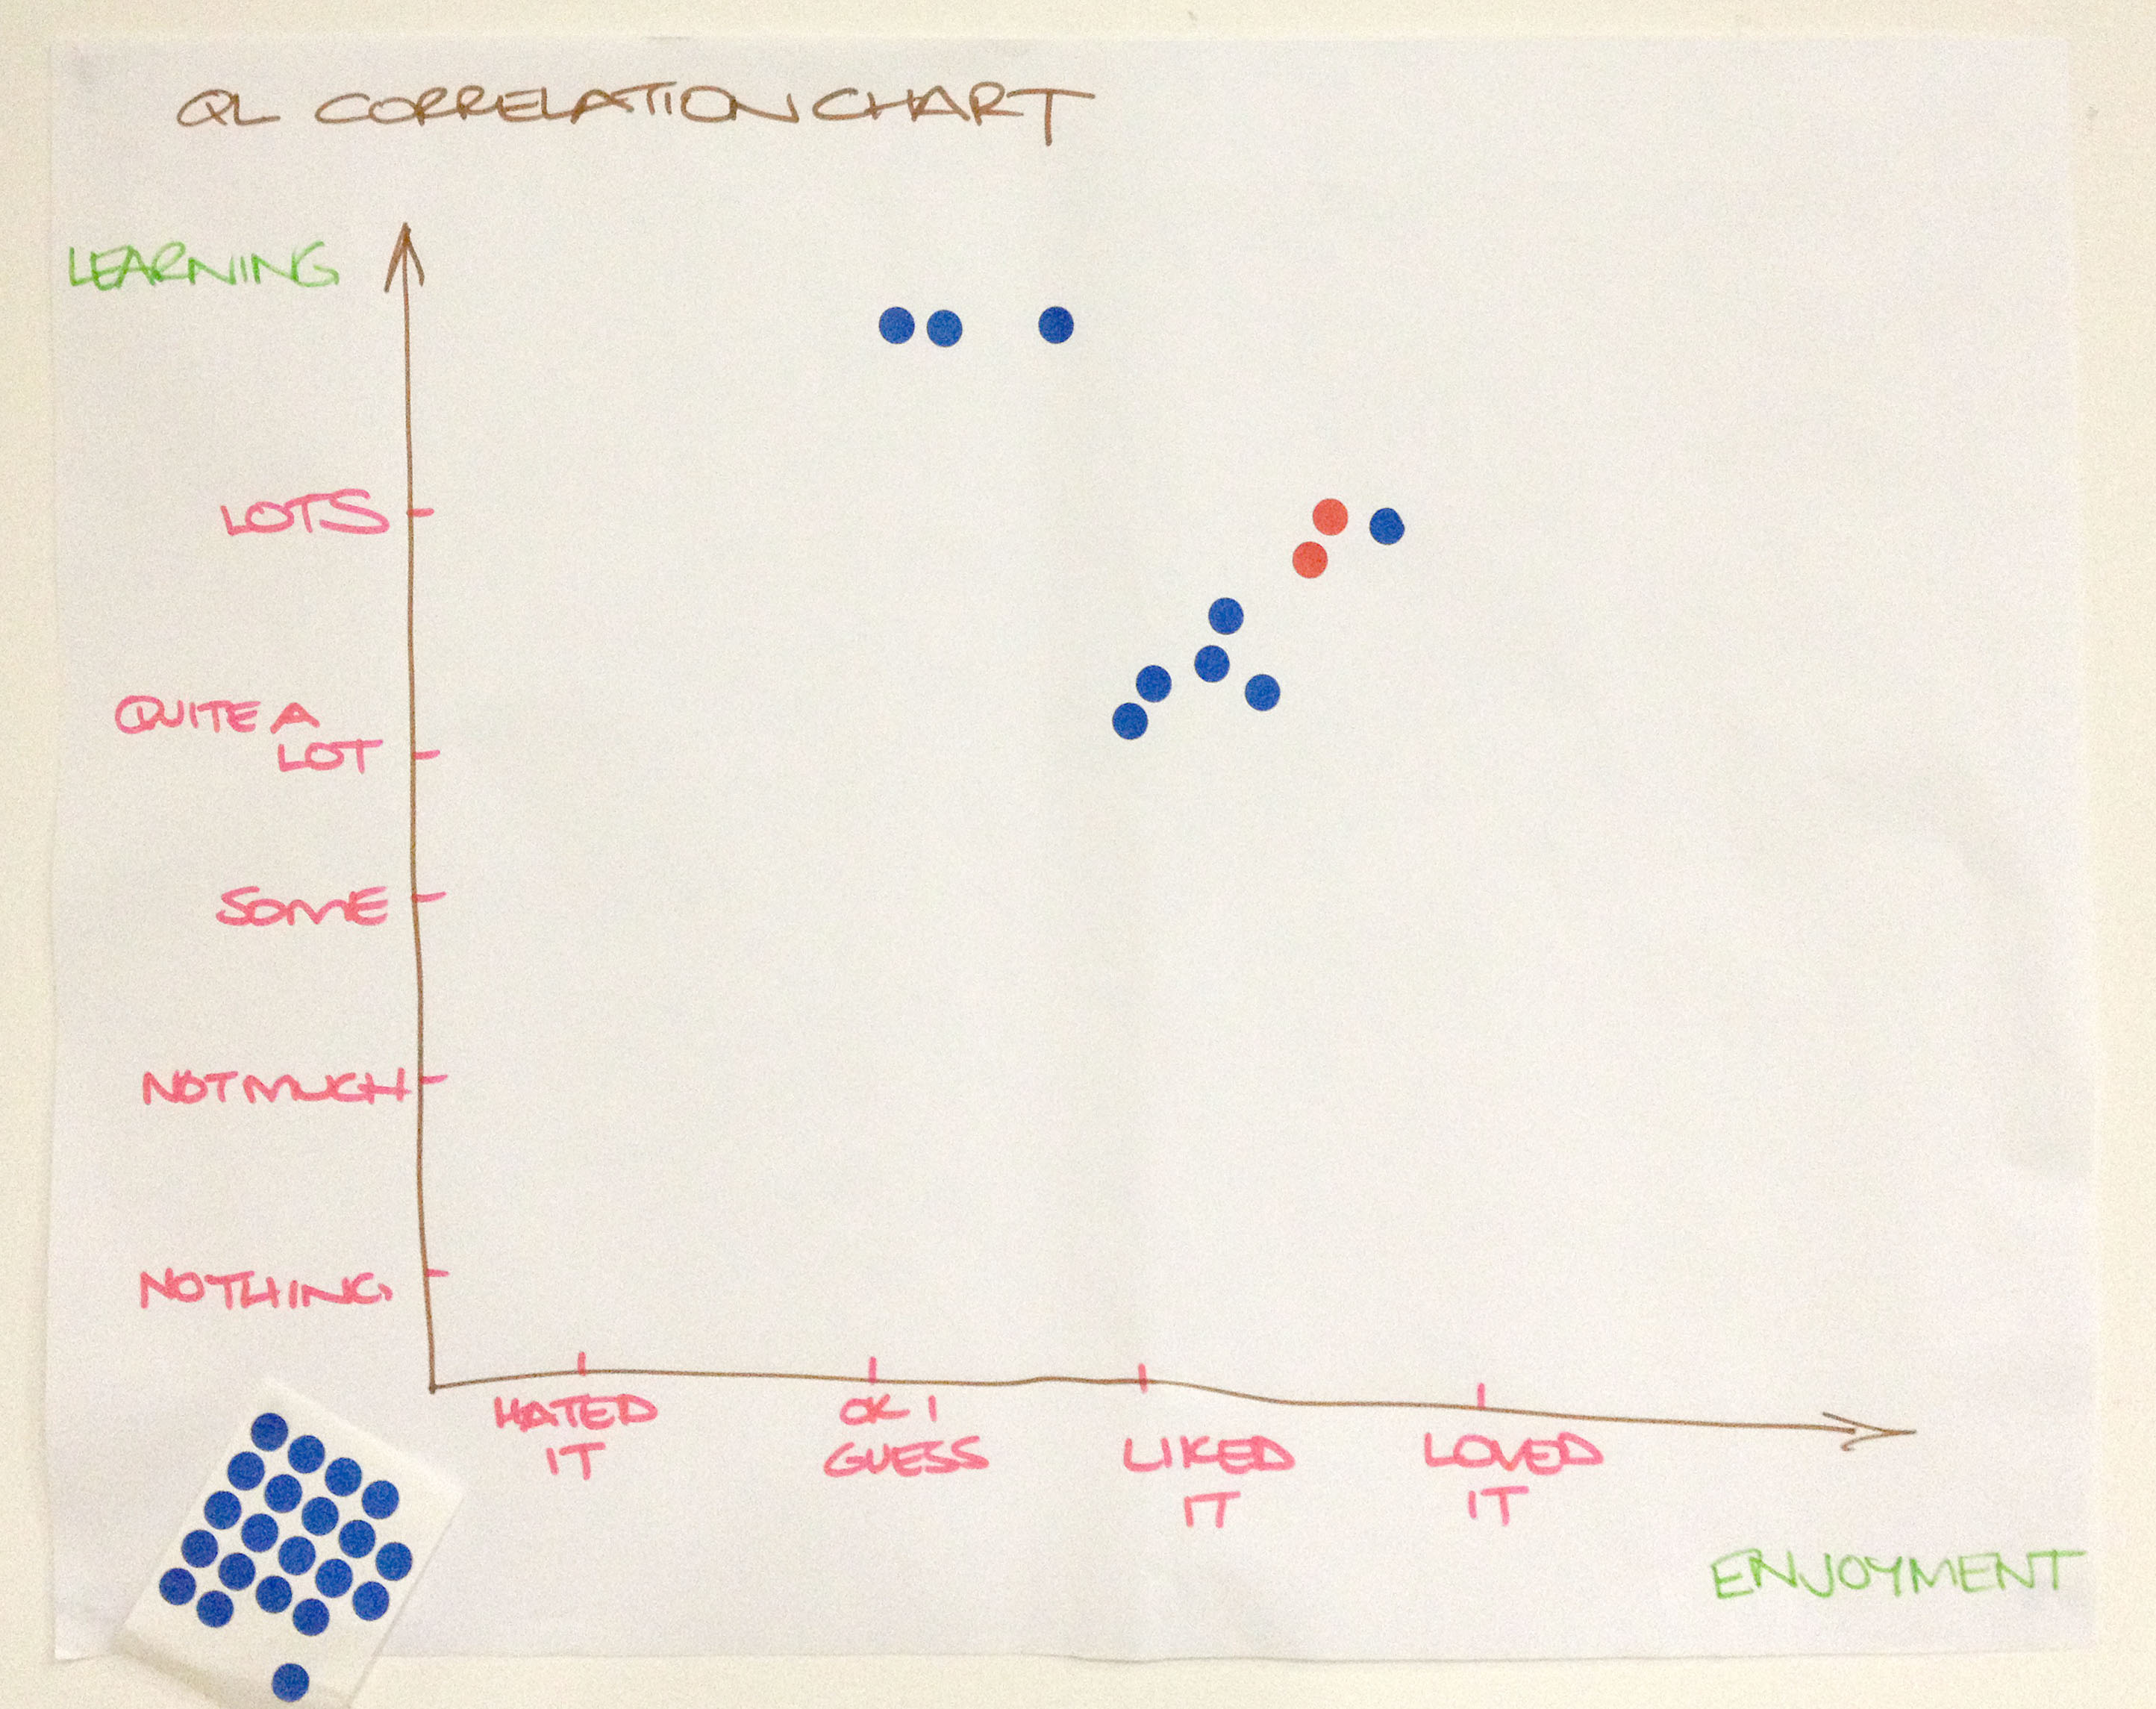
Having determined the questions and scale, the next step is to draw up the correlation chart. It doesn’t have to be typed and printed; hand written charts, such as that shown in Figure 2 work quite well.
Figure 2. A hand-written Correlation Chart
Provide a sheet of adhesive dots (or a marker pen). Invite respondents to place a dot in the chart in response to the two questions.
Consider the relationship
What patterns can you see in the data? In Figure 1, you will notice the tendency for individuals’ ratings of learning and enjoyment to be quite similar. Those who reported they enjoyed the seminar more tended to report learning more. In other words, there is a positive correlation between these variables.
Remember, correlation does not mean causation. Correlation only indicates a relationship exists, it doesn’t explain the nature of the relationship. In Australia, for instance, there is a correlation between sales of ice cream cones and shark attacks; nobody suggests one causes the other.
Decide what to do next
Data inform decisions. We collect data to help us decide what to do next. Be sure to consider what the data are suggesting you need to do.
Benefits of a Correlation Chart
A Correlation Chart is easy to use. It can easily be made during a staff or class meeting, with the results instantly visible for everyone to see. It is much easier than a survey!
Everyone can see their own dots on a Correlation Chart; they know their voice is heard and that their opinion matters.
Like many of the Quality Learning tools, a Correlation Chart gives voice to the silent majority while giving perspective to the vocal minority. People see how their perspective relates to those of others in the group.
Keep in mind
A Correlation Chart does not provide any information regarding the reasons for the responses. Take care not to attribute reasons without further investigation.
Respect the anonymity of the respondents. If there are outlier responses – special causes – that are clearly different to those of the majority, don’t seek to identify the individuals concerned. Rather, invite the individual(s) to have a quiet word with you later so you can understand their perspective. There is frequently richness in the views of outliers.
Educators can get very excited by Quality Learning tools. In this post we explore these tools and how to use them most effectively.
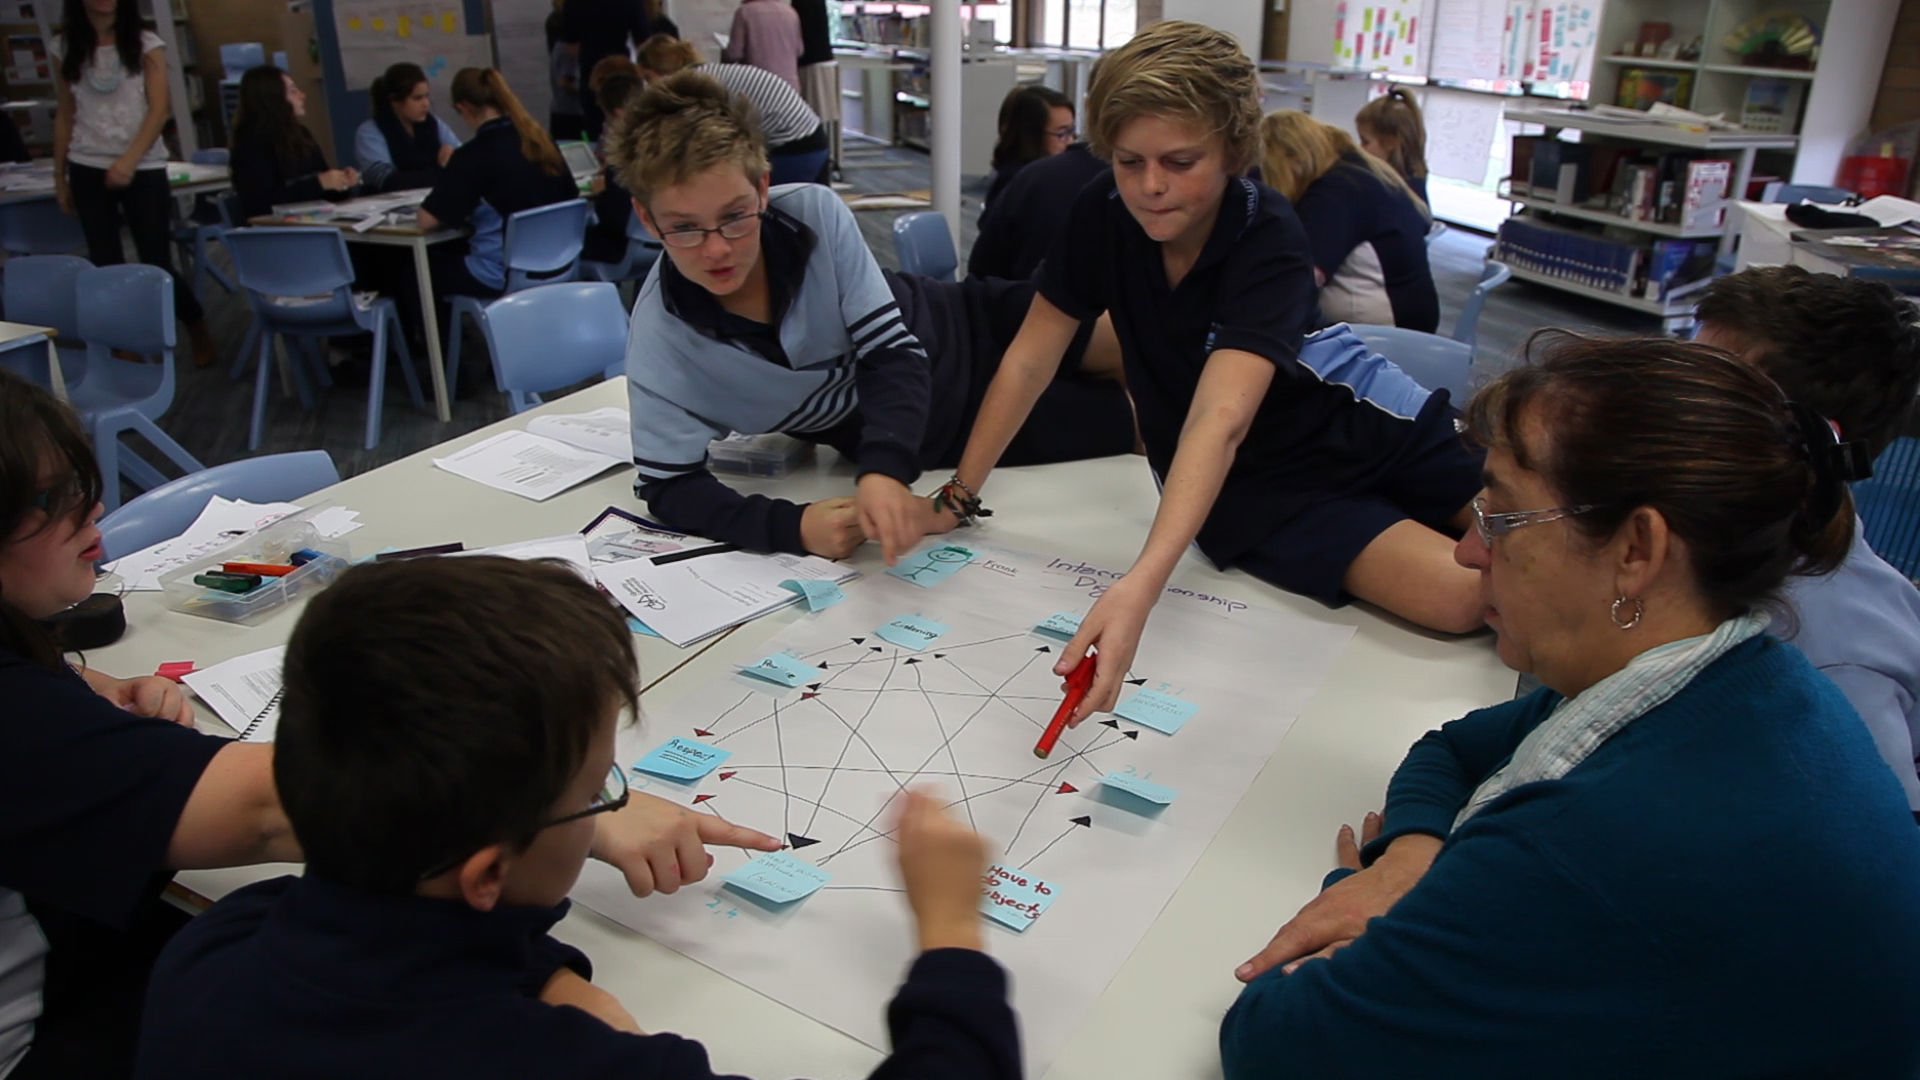
Students from Hallett Cove R-12 School in South Australia complete an Inter-relationship Digraph.
What is a Quality Learning tool?
Let’s start with a definition of any tool.
A tool is a physical or procedural instrument.
A hammer is a tool, a physical instrument for driving nails. A to-do list is a tool, a procedural instrument for helping us remember what we have to get done. The internet is a tool that requires both a physical instrument (computer or smart phone) and procedures to follow to connect and gain access to information.
A Quality Learning tool is a physical or procedural instrument used to improve the quality of learning.
The Quality Learning tools have their origins in quality improvement tools, first introduced in Japan in the 1960s. These early tools, such as the check sheet, fishbone diagram and Pareto chart, were used to gather and display data with a view to improving the quality of products and services. Management tools, such as the affinity diagram, interrelationship digraph and prioritisation matrix, were developed from the 1970s.
Over the past fifty years, additional tools have been developed in the fields of management, planning, statistical analysis, design, inter-personal collaboration, creativity and thinking.
Quality Learning tools are drawn from all of these areas.
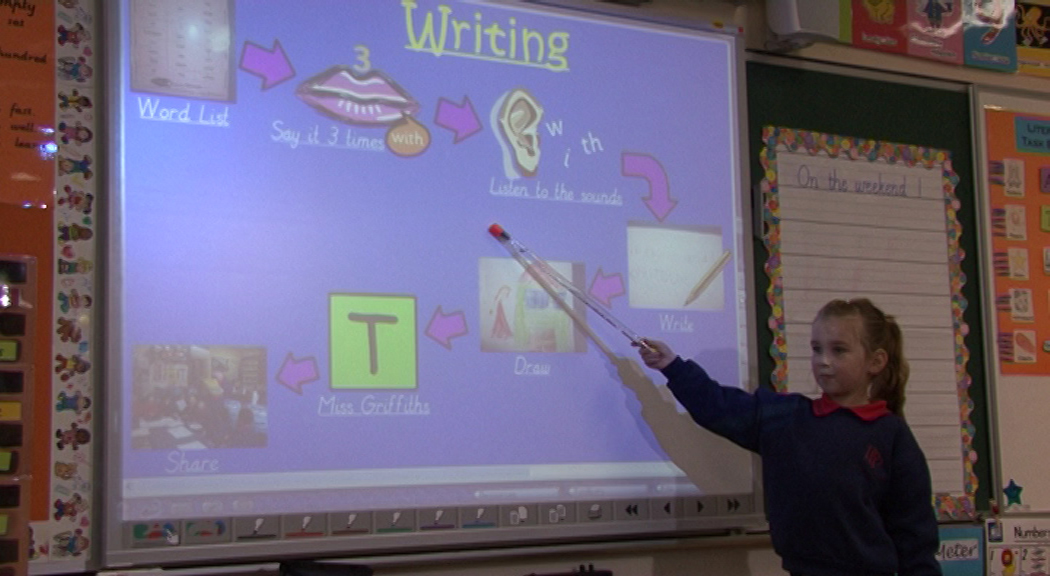
A junior primary student from Plenty Parklands Primary School steps through a flowchart of the class writing process.
Tools and new thinking
Tools are created to solve problems.
New tools usually emerge after thinking about a problem from a new or different perspective.
Consider brainstorming, for example. It is a simple tool. Everyone gets to suggest ideas that are recorded for everybody to see. Traditional brainstorming, however, has a number of weaknesses, including potential domination of the group by outspoken individuals and inconsistent levels of participation by group members. These factors frequently impact negatively on the quality of ideas generated.
To address these weaknesses, structured brainstorming was developed. Key differences between structured and traditional brainstorming are:
All individuals are given time to think about the issue quietly and make a list of ideas they could contribute.
Ideas are gathered progressively from each member of the group: one idea per person per turn, with the option to ‘pass’ on any turn.
Structured brainstorming was developed to solve the problems of traditional brainstorming.
The thinking that preceded the creation of the new tool or the new technique was inadequate; otherwise the tool would not have been needed. If the old thinking could have solved the problem, there would have been no need to develop a new tool to help understand the problem better or analyse it better. So the creation of the tool is usually a consequence of a shift in thinking.
Jim Duffy, 2015, Knowing & Applying: Breathing new life into service organisations, Deming Learning Network, Aberdeen, Scotland, p66
The Quality Learning tools are rooted in the thinking that underpins Quality Learning, namely what Deming called a system of profound knowledge. This philosophy can be summarised as the Principles of Quality Learning.
Tools can encourage everybody to have their say, usually in a structured manner. Everyone comes to understand the perspective of the group as a whole. In this way, they give voice to the silent majority while giving perspective to the vocal minority.
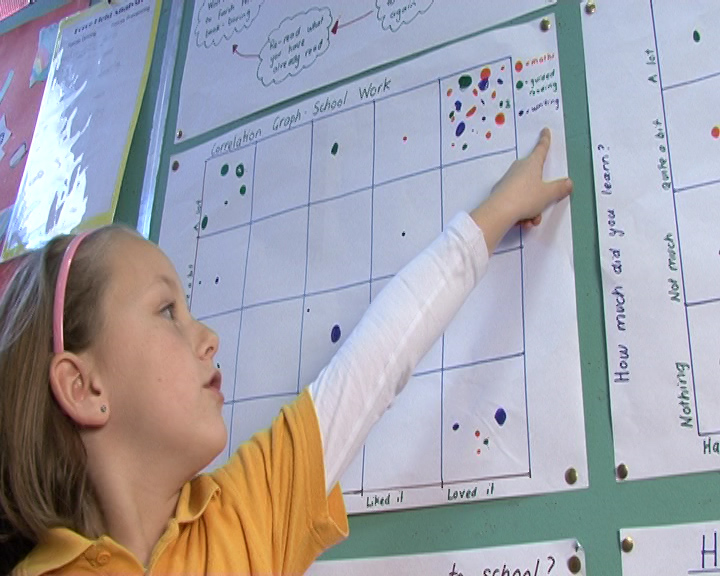
A student from Theodore Primary School in the ACT explains a class Correlation Chart.
Examples of Quality Learning tools
The following table lists many of the most common Quality Learning tools. They are grouped by the key concepts of Systems, Knowledge, Data and variation, and Psychology and motivation. (Remembering, of course, that these concepts are more strongly interrelated than the following linear list of tools suggests.)
Systems thinking
Deployment Flowchart
Fishbone Diagram
Five Whys
Force-field Analysis
Imagineering
Interrelationship Digraph
Paper Passing Purpose Tool (P3T)
Parking Lot
Perception Analysis
Process Accountability Matrix
Purpose, Outcomes, Process, Evaluation (POPE)
SIPOC Modelling
Standard Flowchart
System Map
System’s Progress
Top-down Flowchart
Knowledge and theory
Bone Diagram
Gantt Chart
Hot Dot
Lotus Diagram
Operational Definition
Potential Improvement Matrix
Problem Statement
Data and variation
Affinity Diagram
Box and Whisker Plots
Control Chart
Dot Plot
Histogram
Measures Selection Matrix
Pareto Chart
Radar Chart
Run Chart
Structured Brainstorming
Psychology and motivation
Action and Agreement Record
Capacity Matrix
Code of Cooperation
Consensogram
Loss Function
Plus Delta
There is no definitive list of Quality Learning tools. New ones are being developed daily; old ones are being adapted to new situations. The list above provides a starting point; it may suggest tools you would like to go back to, or new ones you may wish to explore.
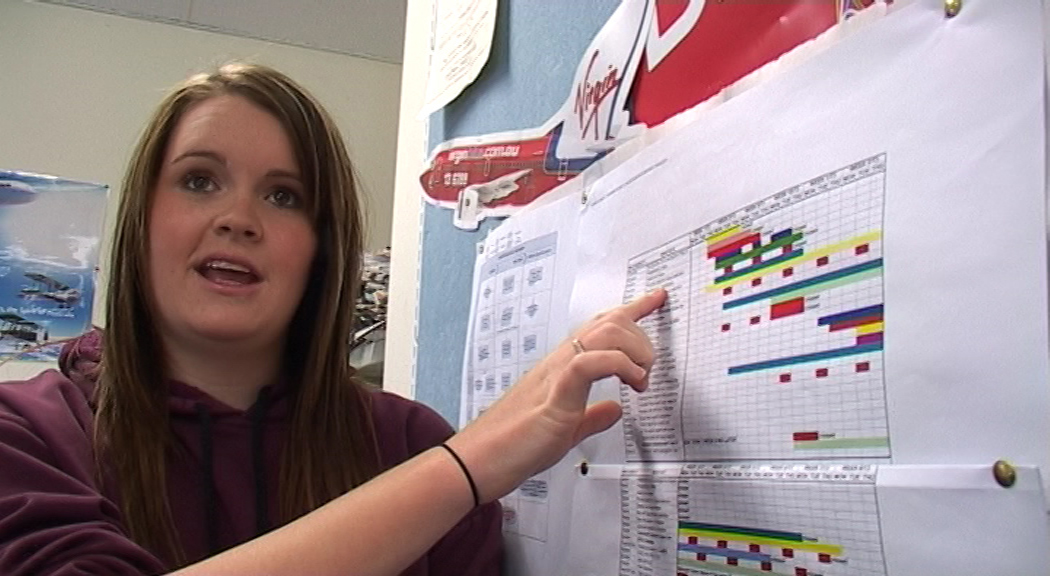
A student from Seaford 6-12 School in South Australia describes the use of a Gantt Chart to plan and track progress of an assignment.
Using the tools
As we work with schools and other organisations, one of the most common questions we are asked is: How do I know which tool to use, and when to use it?
The only way to predict whether a tool will be helpful in any given situation is to have tried the tool and learned from its application.
As you use a tool regularly, you come to know the situations in which it is most helpful and those in which it is not.
Learning about the Quality Learning philosophy can also help you apply the tools effectively, as it can deepen your understanding of the thinking behind the tools.