This is the third in a series of four blog posts to introduce the underpinning concepts related to variation in systems. In the first post we discussed common cause and special cause variation. The second explored the concept of system stability. In this post, we explore whether a system is capable of consistently meeting expectations. This is an edited extract from our book, Improving Learning.
System Capability
Just because a system is stable does not mean that it is producing satisfactory results. For example, if a school demonstrates average growth in spelling of about 70 points from Years 3 to 5, is this acceptable? Should parents be satisfied with school scores that range from 350 to 500? These are questions of system capability.
Capability relates to the degree to which a system consistently delivers results that are acceptable — within specification, and thus within acceptable limits of variation.
Capability: the degree to which a system consistently delivers results that are within acceptable limits of variation.
Note that stability relates to the natural variation that is exhibited by a system, capability relates to the acceptable limits of variation for a system. Stability is defined by system performance. Capability is defined by stakeholder needs and expectations.
It is not uncommon to find systems that are both stable and incapable; systems that consistently and predictably produce results that are beyond acceptable limits of variation and are therefore unsatisfactory. No doubt, you can think of many examples.
Cries for school systems to “raise the bar” or “close the gap” are evidence that stakeholders believe school systems to be incapable (in this statistical sense) because the results they are producing are not within acceptable limits of variation. However, the results are totally predictable, the system is stable, but the results are unsatisfactory; the system is incapable.
In Australia, NAPLAN defines standards for student performance. National minimum standards are defined to reflect a “basic level of knowledge and understanding needed to function in that year level”.
Proficiency standards, which are set higher than the national minimum standards, “refer to what is expected of a student at the year level”. Depending on the year level and learning area, between two per cent and 14 per cent of students fail to reach national minimum standards. By definition, then, the Australian education system is incapable. It fails to consistently produce performance that is within acceptable limits of variation, because a known proportion of students fails to meet minimum standards, let alone perform at or better than the expected proficiency.
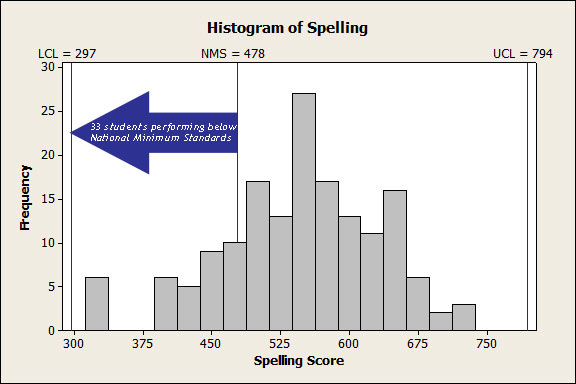
Figure 1 shows the spelling results for 161 Year 9 students at an Australian high school, as measured by NAPLAN. These results fall between the upper and lower control limits, which have been found to be at 297 and 794 respectively. Careful analysis failed to reveal evidence of special cause variation. This system appears to be stable. The national minimum standard for Year 9 students is 478. In this set of data, there are 33 students performing below this standard. Thus we can conclude that the system which produced these spelling results is stable but incapable.
Taking effective action: Responding appropriately to system variation.
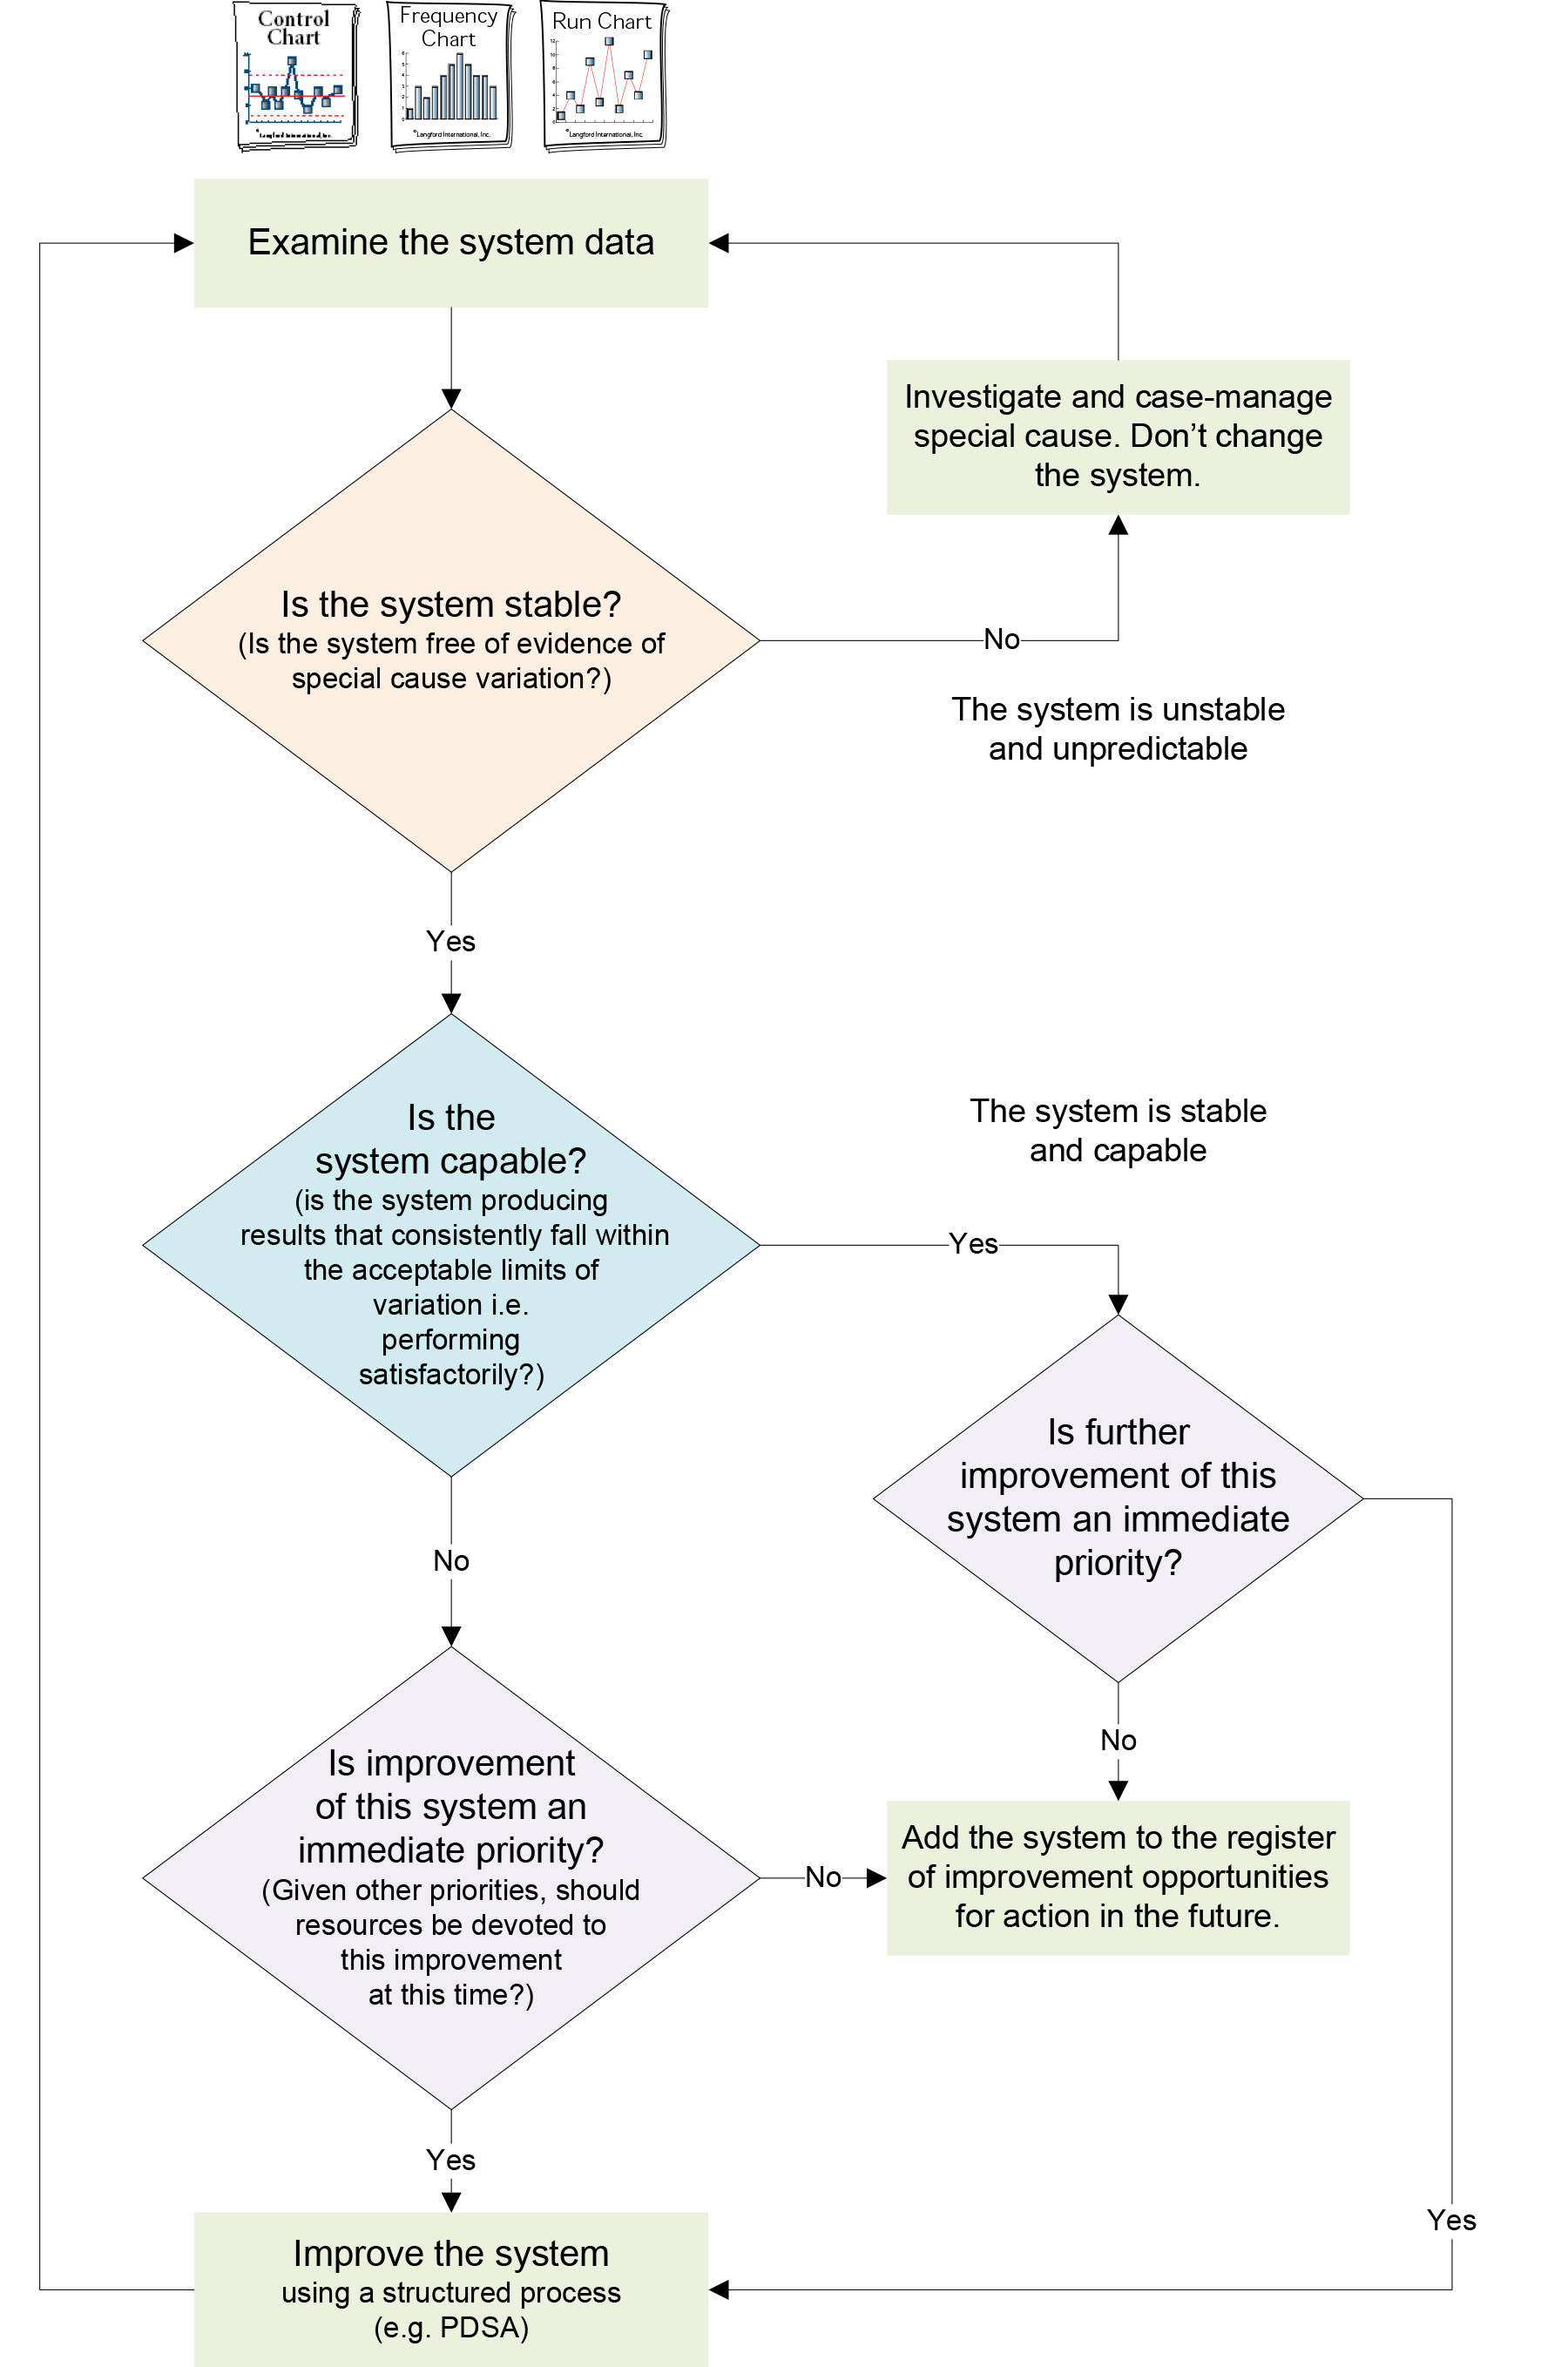
With an understanding of the concepts of common cause and special cause variation, responding to system data becomes more effective. The flowchart in Figure 2 summarises an appropriate response to system data.
In the next post, we describe what can happen when we don’t respond appropriately to variation – tampering! Making things worse.
Read about four types of measures, and why you need them.
Read about common cause and special cause variation.
Read about system stability.
Read more in our comprehensive resource: IMPROVING LEARNING – A how-to guide for school improvement.
Purchase our learning and improvement guide Using data to improve.