The loss function tool is a practical method for determining the optimum value for a process. It is based upon the work of Genichi Taguchi, a Japanese statistician, who identified that losses progressively increase as process settings move away from their optimum, rather than rising instantly when a specification is exceeded.
A loss function can be prepared for any situation where the optimum numerical value of a process variable is sought.
To construct a loss function, each participant is provided with three small sticky notes of different colours.
Firstly, participants note their ideal value on one of the sticky notes.
Secondly, each participant is asked to note the value that would be too small for them on a different coloured sticky note.
Thirdly, each participant then identifies the value that for them would be too great on the third sticky note.
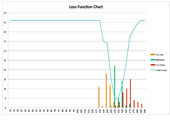
Finally, beginning with the ideal values, three histograms are created on the same sheet. Losses are calculated for each value by determining the number of people that would think that value was too great plus the number of people who find that value too small. The total losses are then added and the point of minimum loss determined.
This MS Excel tempate enables you to capture, store and display the results.


Most resources on this website are free. For some resources, such as this, we require you to register so that we may keep you informed of Quality Learning news and new resources. Should you choose, you will be able to opt out of our communications at any time.