A Gantt chart is a project planning and monitoring tool, which is in common use for project management all over the world. It was first developed a century ago and is named after its developer, Henry Gantt, an American mechanical engineer and management consultant.
The Gantt chart shows, in graphical form, the phases, timing and responsibilities for the activities required to complete a project. It is ideal when all the steps in the action plan are agreed.
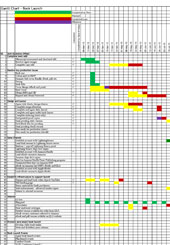
A Gantt chart is a matrix. The rows of the matrix list the activities to be completed, usually grouped into phases. The columns of the matrix represent time, usually in weeks or months. The cells of the matrix are shaded to form bars that indicate when each activity is to be undertaken. There can also be a column to indicate who is responsible for each activity.
Progress can be evaluated against the plan to identify activities that were completed on time, those running ahead of time, and those that are running late.
The Gantt chart is a powerful tool for use with adults, but students also find them very helpful in planning their major learning activities. Gantt charts help students learn how to plan, time manage, and track their learning.
This MS Excel template enables you to create, modify and save an electronic Gantt chart.


Most resources on this website are free. For some resources, such as this, we require you to register so that we may keep you informed of Quality Learning news and new resources. Should you choose, you will be able to opt out of our communications at any time.