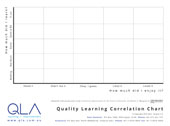
Correlation Chart Poster
The Quality Learning Correlation Chart can be used to gain quick, anonymous feedback from learners about the quality of the learning experience. Each student uses a sticky dot to rate the degree to which they enjoyed the learning experience and the degree to which the believe they learned from it. See an example from year 2.
All prices are shown in Australian Dollars including GST.
Most resources on this website are free. For some resources, such as this, we require you to register so that we may keep you informed of Quality Learning news and new resources. Should you choose, you will be able to opt out of our communications at any time.


