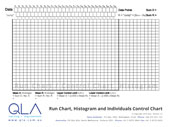
This Control Chart template helps you to observe the variation in a process allowing you to respond appropriately to improve it. The template can be used to record the data and then display it pictorially (as a Run Chart, Control Chart and/or Histogram).
The template guides you through the calculation of the upper and lower limits of natural variation (called control limits) to identify special and common cause variation. This allows you to make better decisions as to the most appropriate course of action.


Most resources on this website are free. For some resources, such as this, we require you to register so that we may keep you informed of Quality Learning news and new resources. Should you choose, you will be able to opt out of our communications at any time.