Using data to improve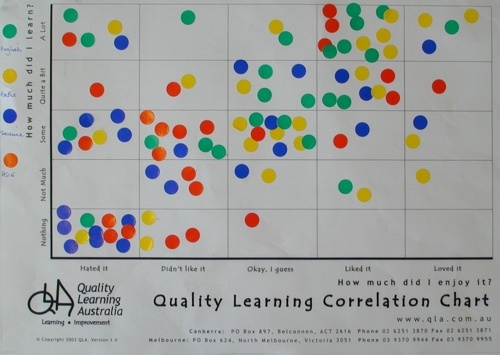
Quality Learning requires the use of data and other evidence to inform our improvement efforts.
We use data to better understand the performance of our processes and systems, to monitor progress, to inform planning and decision-making, and to identify strengths and opportunities for improvement.
It is important to interpret and respond appropriately to what the data are telling us. This is a function of our understanding of the variation exhibited in the data.
Variation is everywhere and in everything. In people, variation is wonderful, and cause for celebration. It brings great richness, learning and innovation to our organisations.
However, too much variation in an organisation’s methods (its systems and processes) leads to chaos.
How we respond to variation in systems and processes is critical to our improvement efforts
It involves distinguishing between common and special cause variation.
How we respond to common or special cause variation must be different.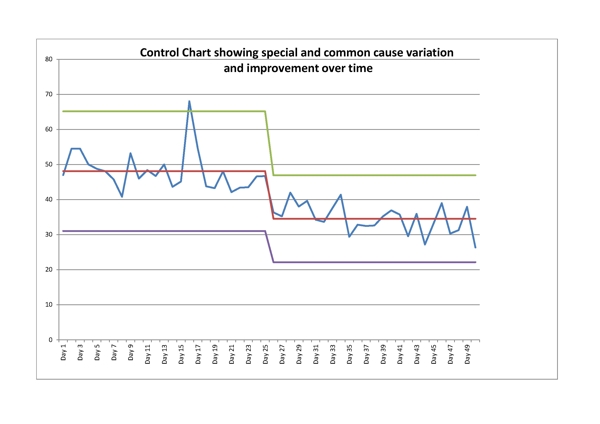
Common cause variation is built into systems and processes. It is the natural variation that occurs as the net result of multiple influences.
To reduce the impact of common cause variation, we must work collaboratively to identify and minimise or eliminate root causes, in order to improve the system.
Special cause variation is due to an exceptional circumstance. It can usually be attributed to a single ‘special’ cause.
To reduce the impact of special cause variation, we must investigate each case individually and ‘case manage’ a specific solution.
Too often in organisations, we fail to study the variation and so respond in the wrong way to special and common cause variation. This is called tampering. Over time, tampering makes things worse.
To use data effectively to improve our organisations we need to know how to:
- decide what to measure
- collect data
- plot points to display the data in a meaningful way
- interpret the data
- act to improve, based on what the data are telling us.
To learn more about data and variation purchase our Using Data to Improve Guide.
Quality Learning tools assist with establishing measures of performance, progress and improvement.
They provide simple, effective and efficient ways to facilitate the collection, display and analysis of data.
These tools include the Measures Matrix, and Perception Analysis. Other tools also facilitate the analysis of data by helping us to display and study the variation in systems and processes. These include the Control Chart, Histogram, Radar Chart and Correlation Chart.
Download a Measures Selection Matrix template, Measures Definition template, Perception Analysis Tool template, Control Chart template, Radar Chart template.