Analysing cause and effect
(the Fishbone Diagram)
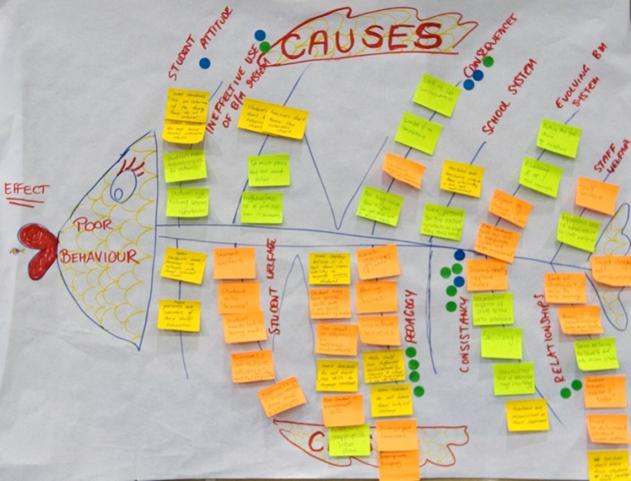
The Fishbone Diagram (also known as the Ishikawa or Cause and Effect Diagram) allows us to explore the range of causes that may result in a given effect (usually a problem or issue).
Exploring the causes reduces the temptation to ‘jump to solution’. It also helps to expand our thinking from simple linear cause and effect to consideration of the many causes within the system, as well as the causes coming from the external environment. Root underlying causes must be identified and addressed for lasting improvement to be achieved.
Learn more about the Fishbone Diagram:
- search our database of resources for a Fishbone Diagram template and examples
purchase a Using Data to Improve Guide.