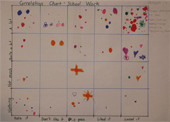
Correlation Chart (Year 2)
A correlation chart can be used to gather feedback and explore the relationship between two factors. In this example from Year 2 at Theodore Primary School ACT the students provide feedback on their learning and enjoyment of different learning areas.


All prices are shown in Australian Dollars including GST.
Most resources on this website are free. For some resources, such as this, we require you to register so that we may keep you informed of Quality Learning news and new resources. Should you choose, you will be able to opt out of our communications at any time.